
The True Value of a Stock Market Portfolio 🏰
A better way of looking at portfolio performance 💎

Hi there, investor 👋
Today we’re looking at what the true value of a portfolio is.
Many view the price as the true value of the portfolio, but is that fair?
Mr. Market is a manic depressive that changes his mind constantly.
We’ve seen it hundreds of times, a high quality business sells off due to a prevailing narrative.
Meta Platforms traded at a single digit multiple in 2022 after a series of bad news:
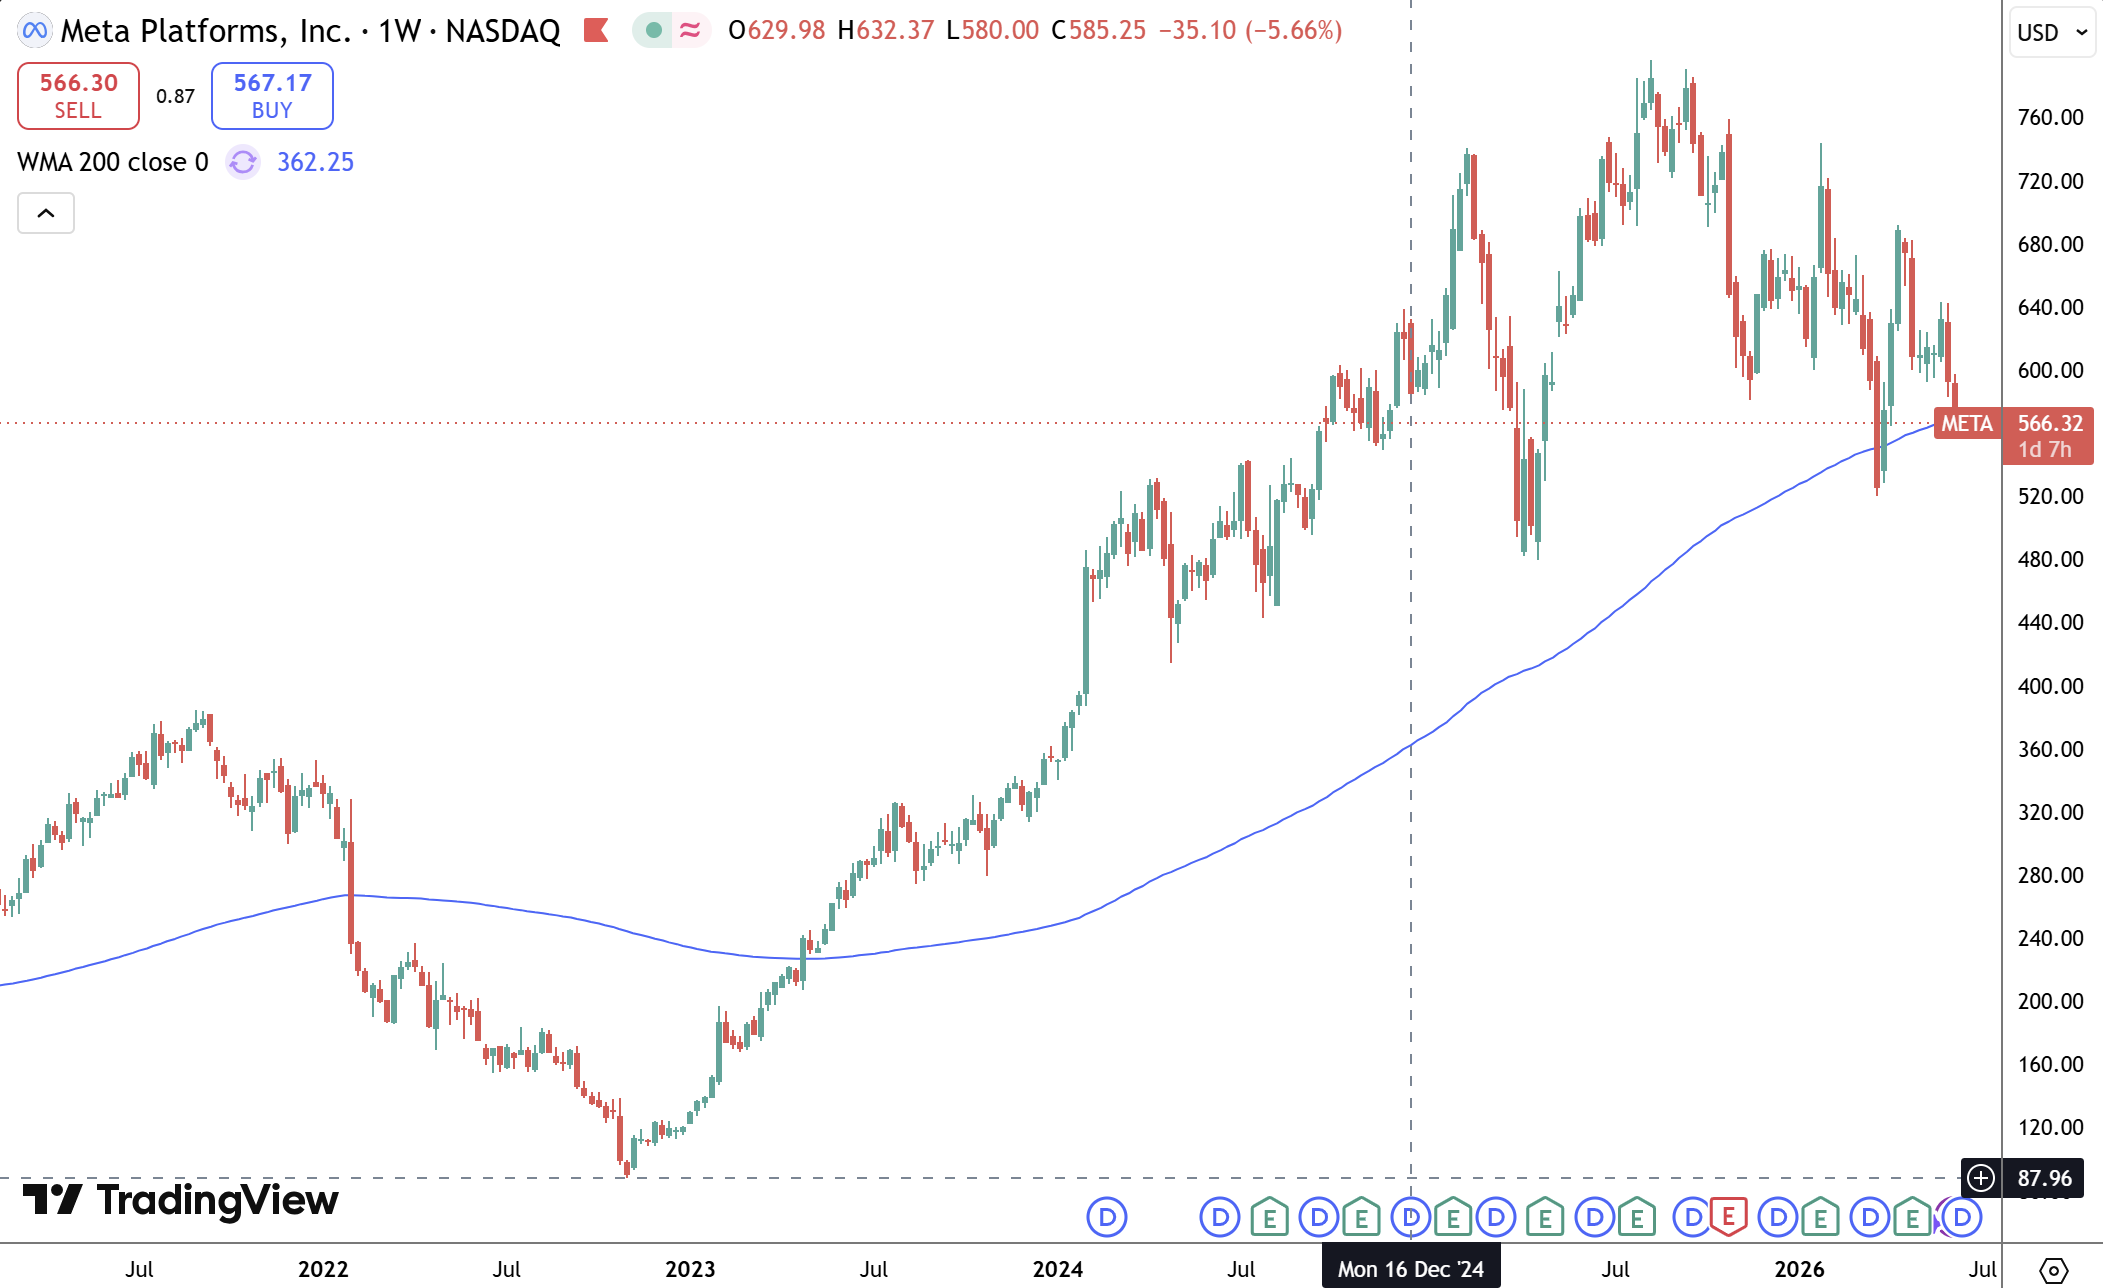
The stock sold off big time. So what did Meta do to change the trend? Nothing special, it continued to deliver solid growth, high margins, and produce high levels of free cash flows.
The price went up +700% in less than 3 years… Same business, but a radical different price.
This begs the question: Is price really a good measure of the true value of a portfolio?
If we look at the business, it most often hasn’t changed at all, even if the stock price has changed significantly.
After all, we’re trying to buy great businesses and be long-term business owners, not stock traders.
So, today, I want to show you how I look at the true value of the portfolio, and more importantly, how I evaluate if a purchase was successful or not.
A better way to look at the true value of a stock portfolio
The true value of the portfolio: earnings and free cash flows per share
I look at both, because free cash flows can be temporarily depressed due to large capex investments. And earnings can be more easily manipulated by accounting shenanigans.
Why focus on earnings and free cash flow per share?
The short answer: Earnings & free cash flows is the weighing machine, stock price is the voting machine. And in the long-term, the weighing machine wins.
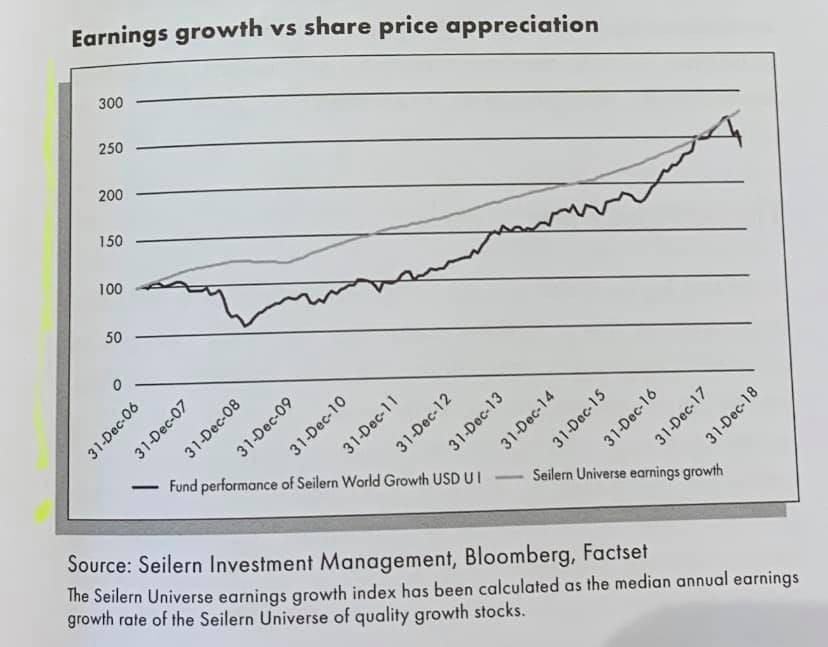
In the long-run, the stock price will follow the growth in earnings. In the short-term, you have no control over how the market will price that growth.
Of course, we have to look at a broader picture, to consider how our portfolio is rated compared to other indexes like the S&P 500, MSCI world index and the ‘risk free rate’ of the 10 year treasury bond.
Factors worth tracking for your portfolio:
The PE and FCF yield
Compare PE and FCF to the S&P 500 and the MSCI world index
Compare FCF yield to the risk free rate (10 year treasury bond yield)
The expected future growth
Compare it to the expected growth of the S&P 500, MSCI world index, and expected GDP growth globally or for the US.
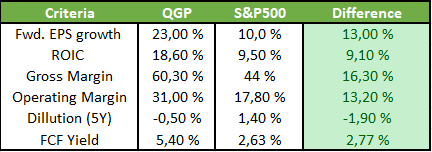
Here is a overview how I compare my portfolio to the S&P 500:
Successful investments
So, we can’t control how the market rates our businesses, but we can control our entry price, or what multiple we purchase the business at.
Buying a great business at a high multiple is a high risk endeavors, we have the classic example of Microsoft, that used 16 years to regain its dot com bubble highs:
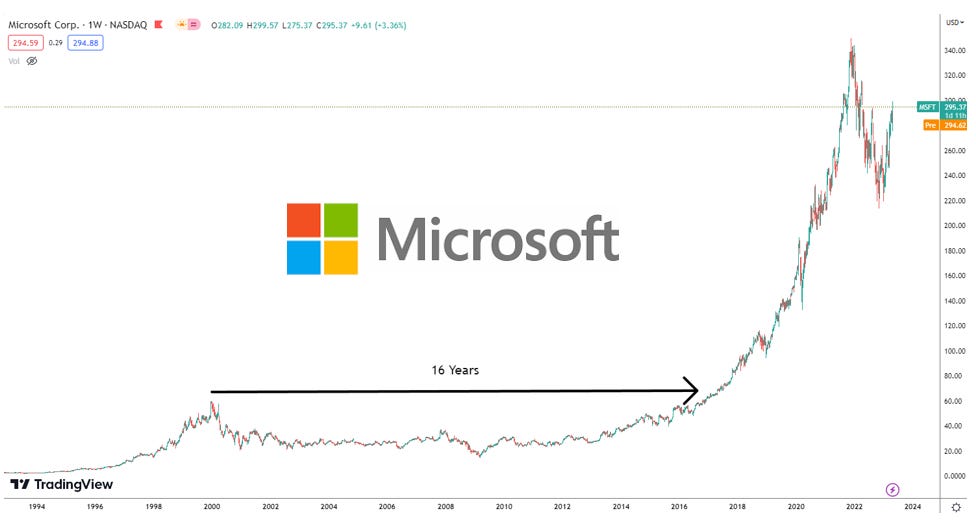
But buying a business at a low multiple can be just as unprofitable as buying Microsoft in 2000.
There are plenty of examples of former darlings that the market used to love, but just keep rating lower and lower.
A well known examples is Evolution AB. The market used to look at the business like an unstoppable force in a growing global market, rating the business at ~90x earnings at its peak.
90x, became 30x, 30x became 10x.
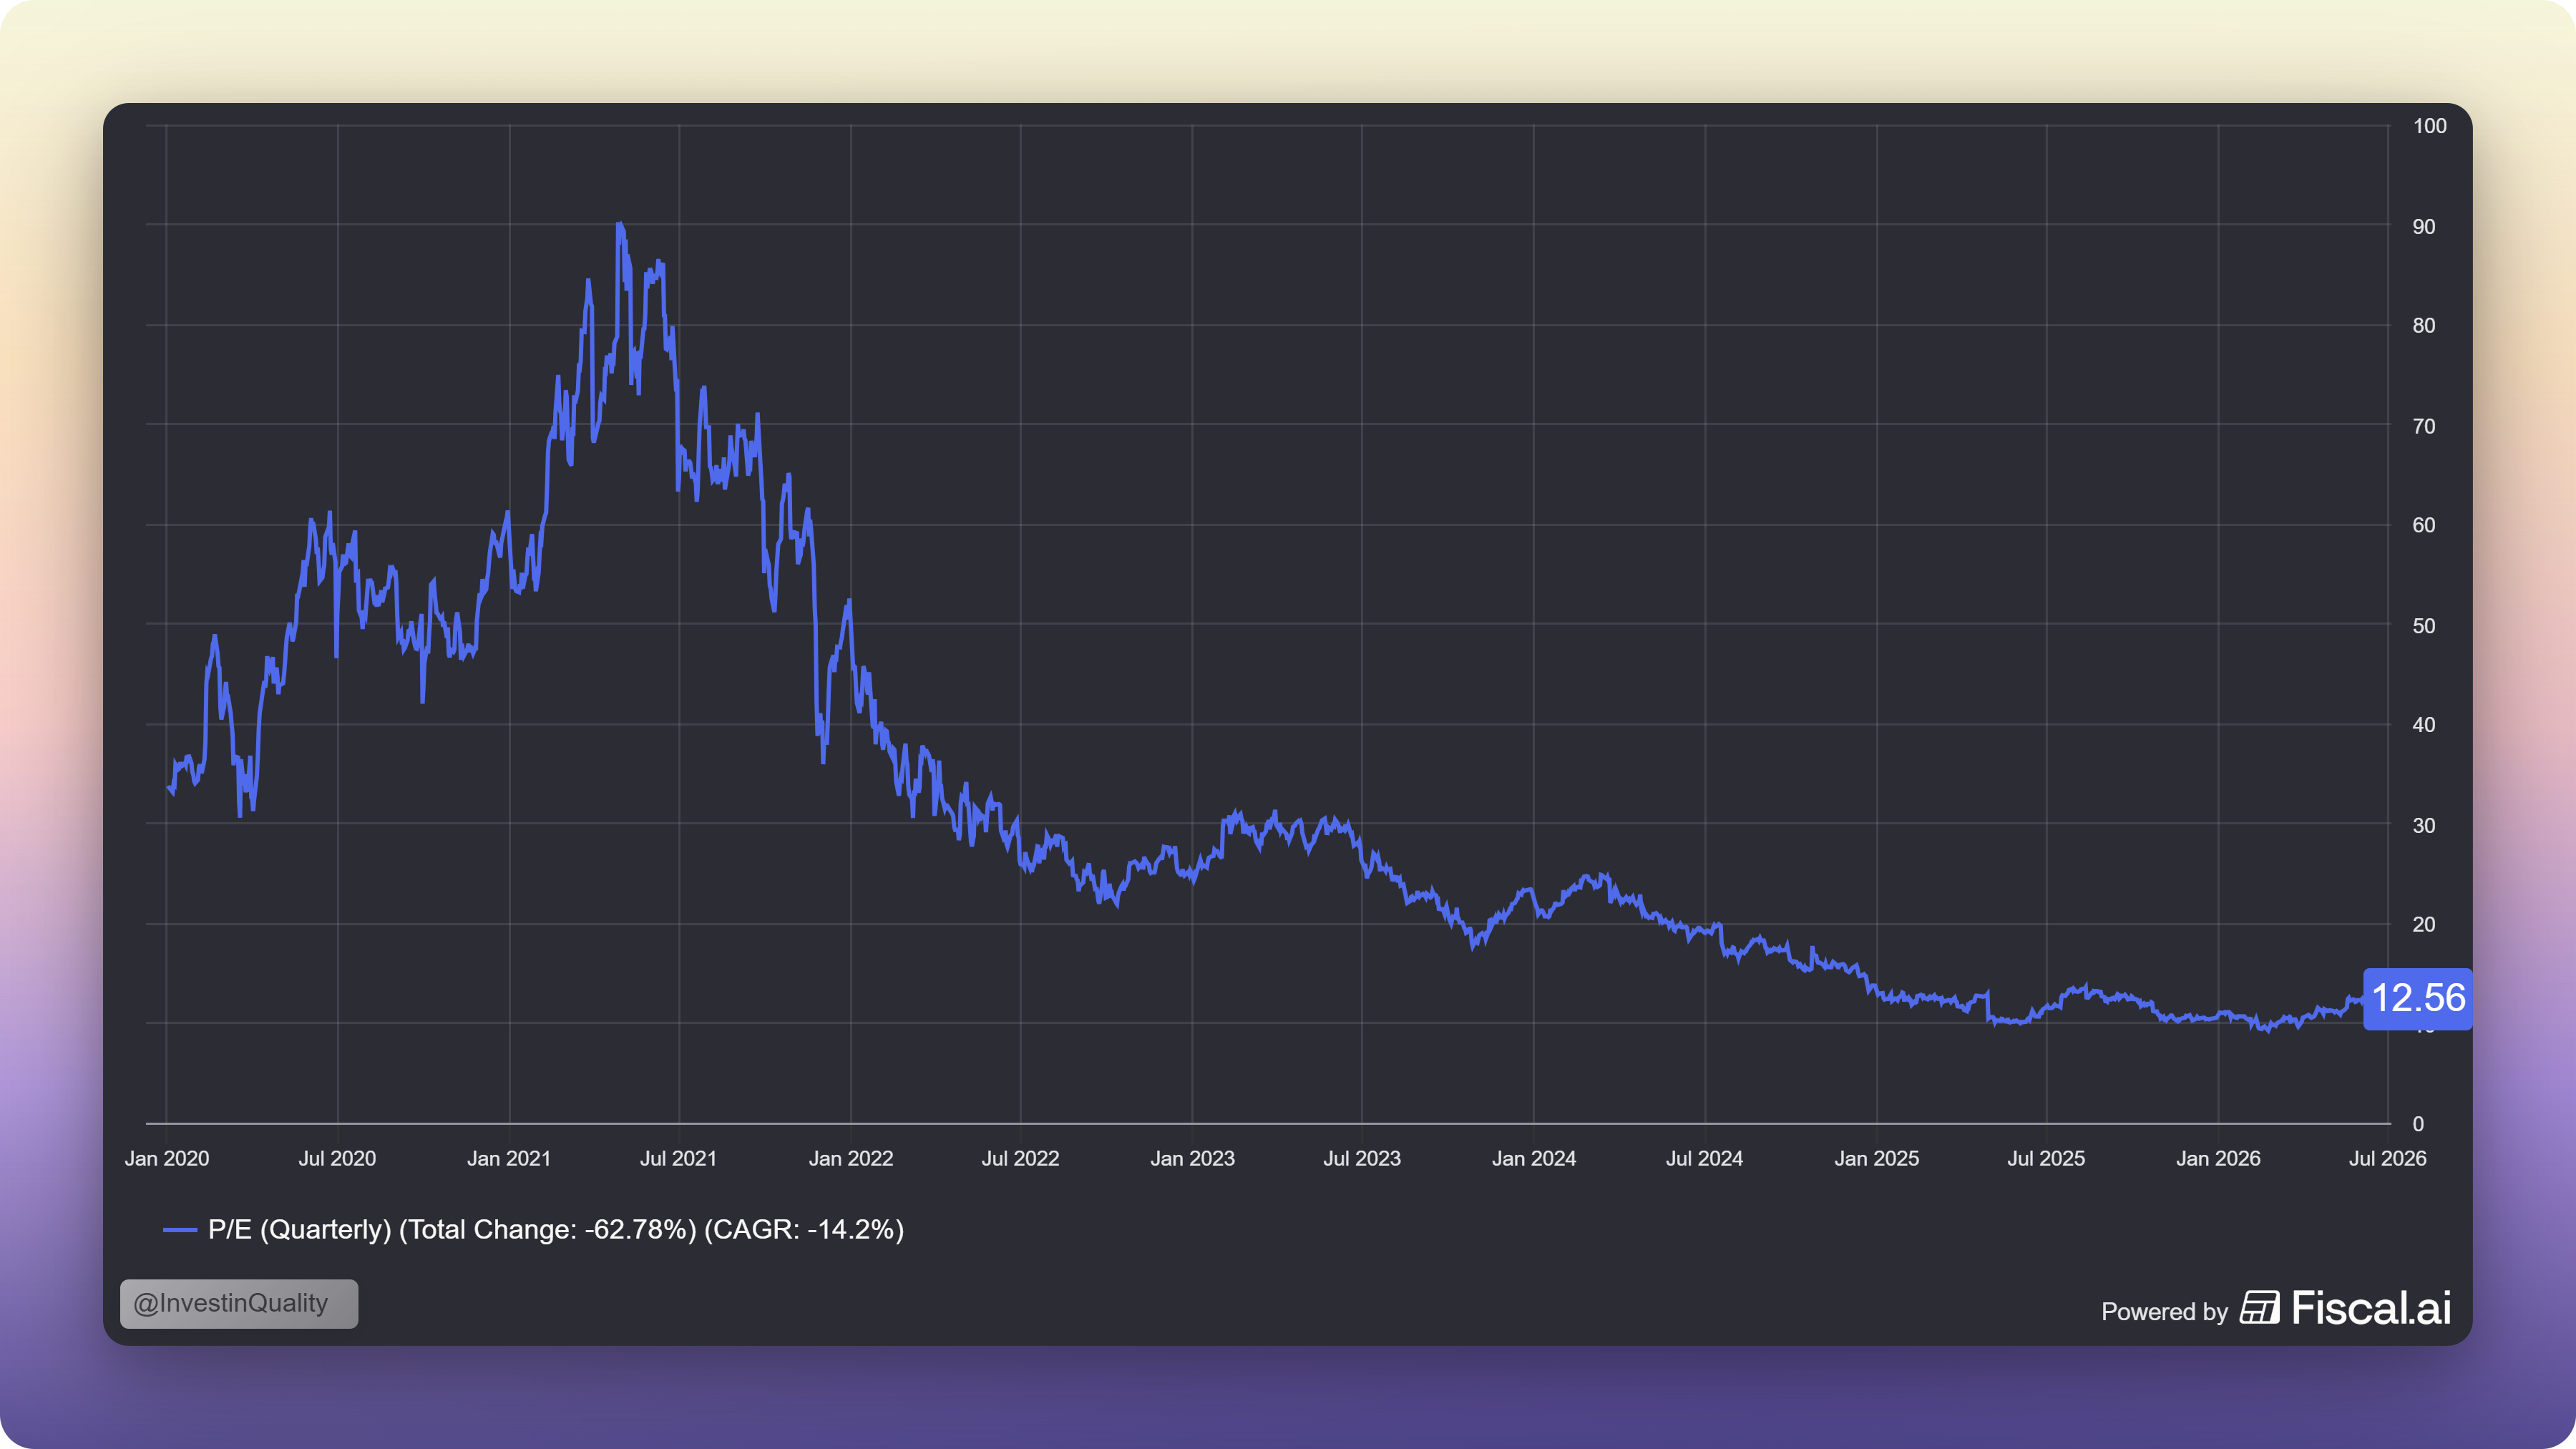
So, buying a business at low (or lower) multiples is not enough, we have to be right about the business, and the discount the market applies to the stock has to be overestimated.
So, entry price is important, and buying a quality business that will continue to grow its earnings and free cash flows per share over time is important.
In periods of multiple contraction, or when the stock price is selling heavily off, like we see in the software industry right now, how should we think about tracking the real performance of our portfolio?
Look-through earnings: The real scorecard
This brings us to a powerful tool for evaluating your portfolio: look-through earnings.
Warren Buffett introduced this idea in his 1989 annual report, specifically to help Berkshire Hathaway shareholders understand the true performance of their equity portfolio. The logic is simple: Rather than looking at what the market says your stocks are worth today, you add up your proportional share of the earnings of every business you own.

François Rochon, founder of Giverny Capital, has applied this framework for decades. As he explains:
“A stock portfolio is the same thing as a holding company, with fractional ownership (even if very small) instead of total ownership.”
This means that if you own 50 shares of a company, you are not holding a ticker symbol. You are a part-owner of a real, cash generating business.
These businesses have real customers, employees, and make real money.
The stock price only tells you what the market is willing to pay for one slice of this business on this day.
Look through earnings tells you what your slice of the business actually produces.
Rochon illustrates this with a simple example.
Imagine a $100,000 portfolio made up of:
2,000 shares of ABC (trading at $25 a share). Total value: $50.000
500 shares of XYZ (trading at $100). Total value: $50.000
ABC earned $2 per share, XYZ earned $8.
Multiply each by the shares you own, and your total owner’s earnings were $8,000.
The following year, ABC earned $2.40 and XYZ earned $9. Your owner’s earnings grew to $9,300.
This is a 16% growth rate, regardless of what either stock did in the market that year.
That 16% is the real scorecard. Not what Mr. Market said your portfolio was worth on any given Tuesday.
Why price alone is a terrible measure of performance
Buffett put it plainly:
“In the short run, the market is a voting machine. In the long run, it is a weighing machine.”
The voting machine can be wildly irrational.
Rochon points to Coca-Cola as a perfect case study. In 2000, Coke traded at a PE of 41. 10 years later, the stock had barely moved:
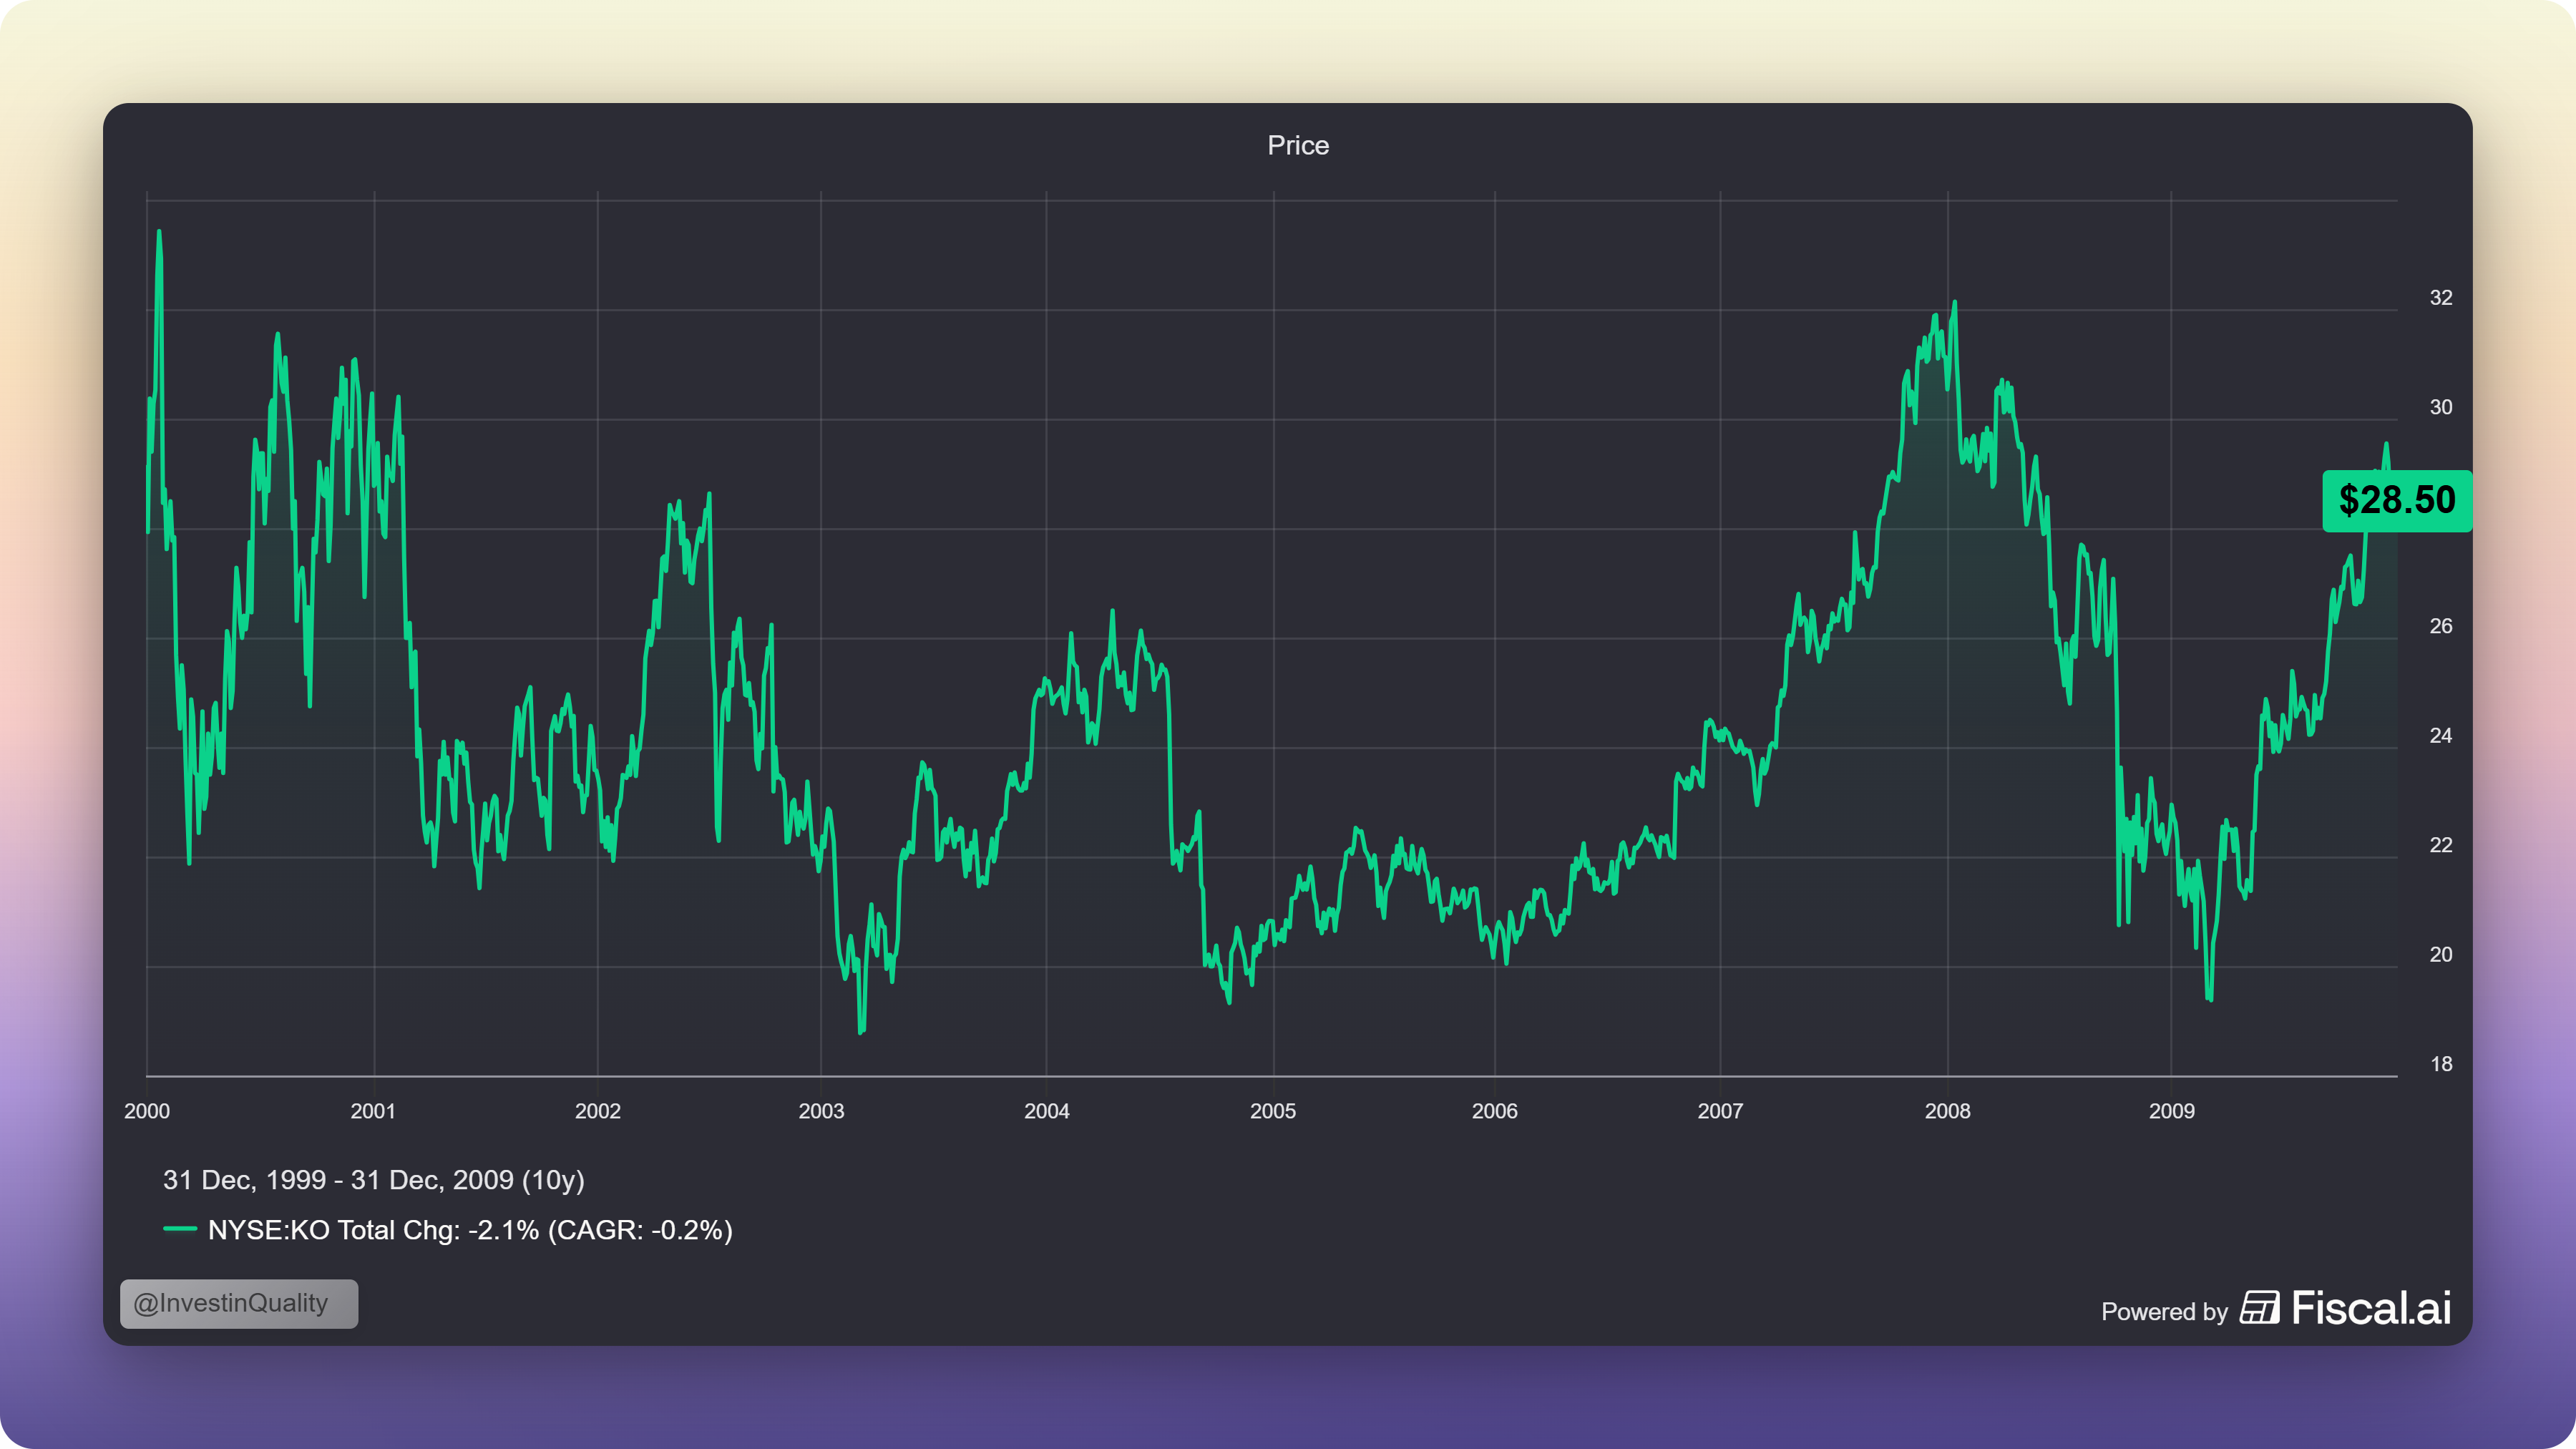
Over that same period, earnings nearly tripled, a nine percent annual growth rate. The business did its job. The stock didn’t move, because investors in 2000 had massively overpaid.
As Charlie Munger said:
“All intelligent investing is value investing, acquiring more than you are paying for. You must value the business in order to value the stock.”
Two factors that determine intrinsic value
Rochon is direct about what actually drives intrinsic value, and he identifies two factors that the market frequently gets wrong.
The first is the future prospects of the business.
Earnings can grow 20% in a year, but if the underlying business model does not look sound over the next five years, that growth will prove temporary and should not be considered a true increase in intrinsic value.
This is why great investors spend most of their time on qualitative analysis: the moat, the management, the competitive dynamics, not just the spreadsheet or discounted cash flow analysis.
Determining future prospects is inherently subjective and imprecise, but it is the work.
The second factor is the price you pay.
If you pay too high a price relative to intrinsic value, even if intrinsic value grows at a good rate, you will not be rewarded by the market.
The Coca-Cola example above is the proof. Overpay at 41x earnings, wait twelve years as earnings triple, and still earn almost nothing. The valuation contraction absorbed all the compounding.
This is why entry multiple is something you can and must control. You cannot control how Mr. Market rates your businesses next year. You can control what you pay today.
How to use this in practice
Each year, calculate your portfolio’s total owner’s earnings. Add up your share of earnings across every position you hold.
Owner earnings can be calculated as follows:
Earnings or FCF per share + dividend per share x # of shares
This can (And should) be done every quarter to keep track of your holdings.
Then compare that number to the prior year. That growth rate is your real return on the underlying businesses, independent of market noise.
Rochon does exactly this at Giverny Capital. As he writes:
“Each year, in the letter I write to our partners, I include a section called ‘owner’s earnings’ with a long-term table of annual results of the companies we own compared to the performance of the underlying stocks. By adding dividends to the growth rate of earnings, I can come up with a combined intrinsic value performance of the companies we own.”
For your own portfolio, you want to see:
Owner’s earnings growing faster than your benchmark index (E.g. S&P 500 or MSCI World Index) underlying earnings growth
A PE and FCF yield that is reasonable relative to the index and the risk-free rate
Expected future growth that justifies the multiple you paid at entry
If those three things are true, you are in good shape, even if the market hasn’t recognized it yet.
Rationality in the face of volatility
The deepest benefit of looking through earnings is psychological. When you know your businesses are compounding earnings at 12-15% per year, a 30% market drawdown stops being terrifying and starts being an opportunity. You are no longer at the mercy of Mr. Market’s mood swings, because you have an independent measure of whether your investments are working.
Rochon makes this point directly:
“This helps us in two ways. First, we can be much more rational with market fluctuations by focusing on the intrinsic performance of the companies we own instead on their quoted prices. Also, it helps us focus on our long-term objective.”
Buffett has said the same thing for fifty years. The stock market exists to serve you, not to instruct you. If it offers you a great business at a silly price, buy more. If it prices your existing holdings at a premium to intrinsic value, enjoy the quotation and do nothing.
Concluding Thoughts
The true value of your portfolio is not the number on your brokerage screen this morning. It is the sum of what your businesses are earning on your behalf, growing year after year, compounding quietly regardless of what any market does on any given day.
Get the entry multiple right. Own businesses with durable earnings power and strong future prospects. Track your look-through earnings annually, not your portfolio price daily.
Do that consistently, and the market will eventually do the weighing, and the price will follow the earnings.
Ready to take the next step? Here’s how I can help you grow your investing journey:
Go Premium — Unlock exclusive content and follow our market-beating Quality Growth portfolio. Learn more here.
Essentials of Quality Growth — Join over 300 investors who have built winning portfolios with this step-by-step guide to identifying top-quality compounders. Get the guide.
Free Valuation Cheat Sheet — Discover a simple, reliable way to value businesses and set your margin of safety. Download now.
Free Guide: How to Identify a Compounder — Learn the key traits of companies worth holding for the long term. Access it here.
Free Guide: How to Analyze Financial Statements — Master reading balance sheets, income statements, and cash flows. Start learning.
Get Featured — Promote yourself to over 24,000 active stock market investors with a 42% open rate. Reach out: investinassets20@gmail.com
The look-through earnings framework is a powerful tool for evaluating what you own. In my 25 years as both a fund selector and asset allocator, I have seen this kind of rigorous business analysis make the difference within an equity portfolio.
But in my experience, the most consequential decision comes before stock selection: how much of the total portfolio should be in equities in the first place. Asset allocation research consistently shows that the split between equities, bonds, and other asset classes explains the vast majority of long-term portfolio returns, not which stocks you pick within the equity sleeve.
Getting the entry multiple right on a great business matters. In my view, getting the asset allocation right matters more.
nice write up