
Copart: Quality Compounder Trading at a Discount 📈
Cheapest valuation in a decade, zero debt, strong fundamentals 💎

Hi there investor 👋
Today we’re breaking down a quality darling trading at its cheapest valuation in a decade.
Most investors don’t pay attention to Copart.
It’s a company that picks up totalled cars, stores them on land it owns near every major city in America, and sells them at online auction to a global network of 300,000 registered buyers.

They don’t have any exciting AI products, they don’t go viral, and there is nothing fancy about the business. They make money on crashed cars, owned real estate, and a marketplace that has compounded for four decades, run by a family with deep expertise in the industry.
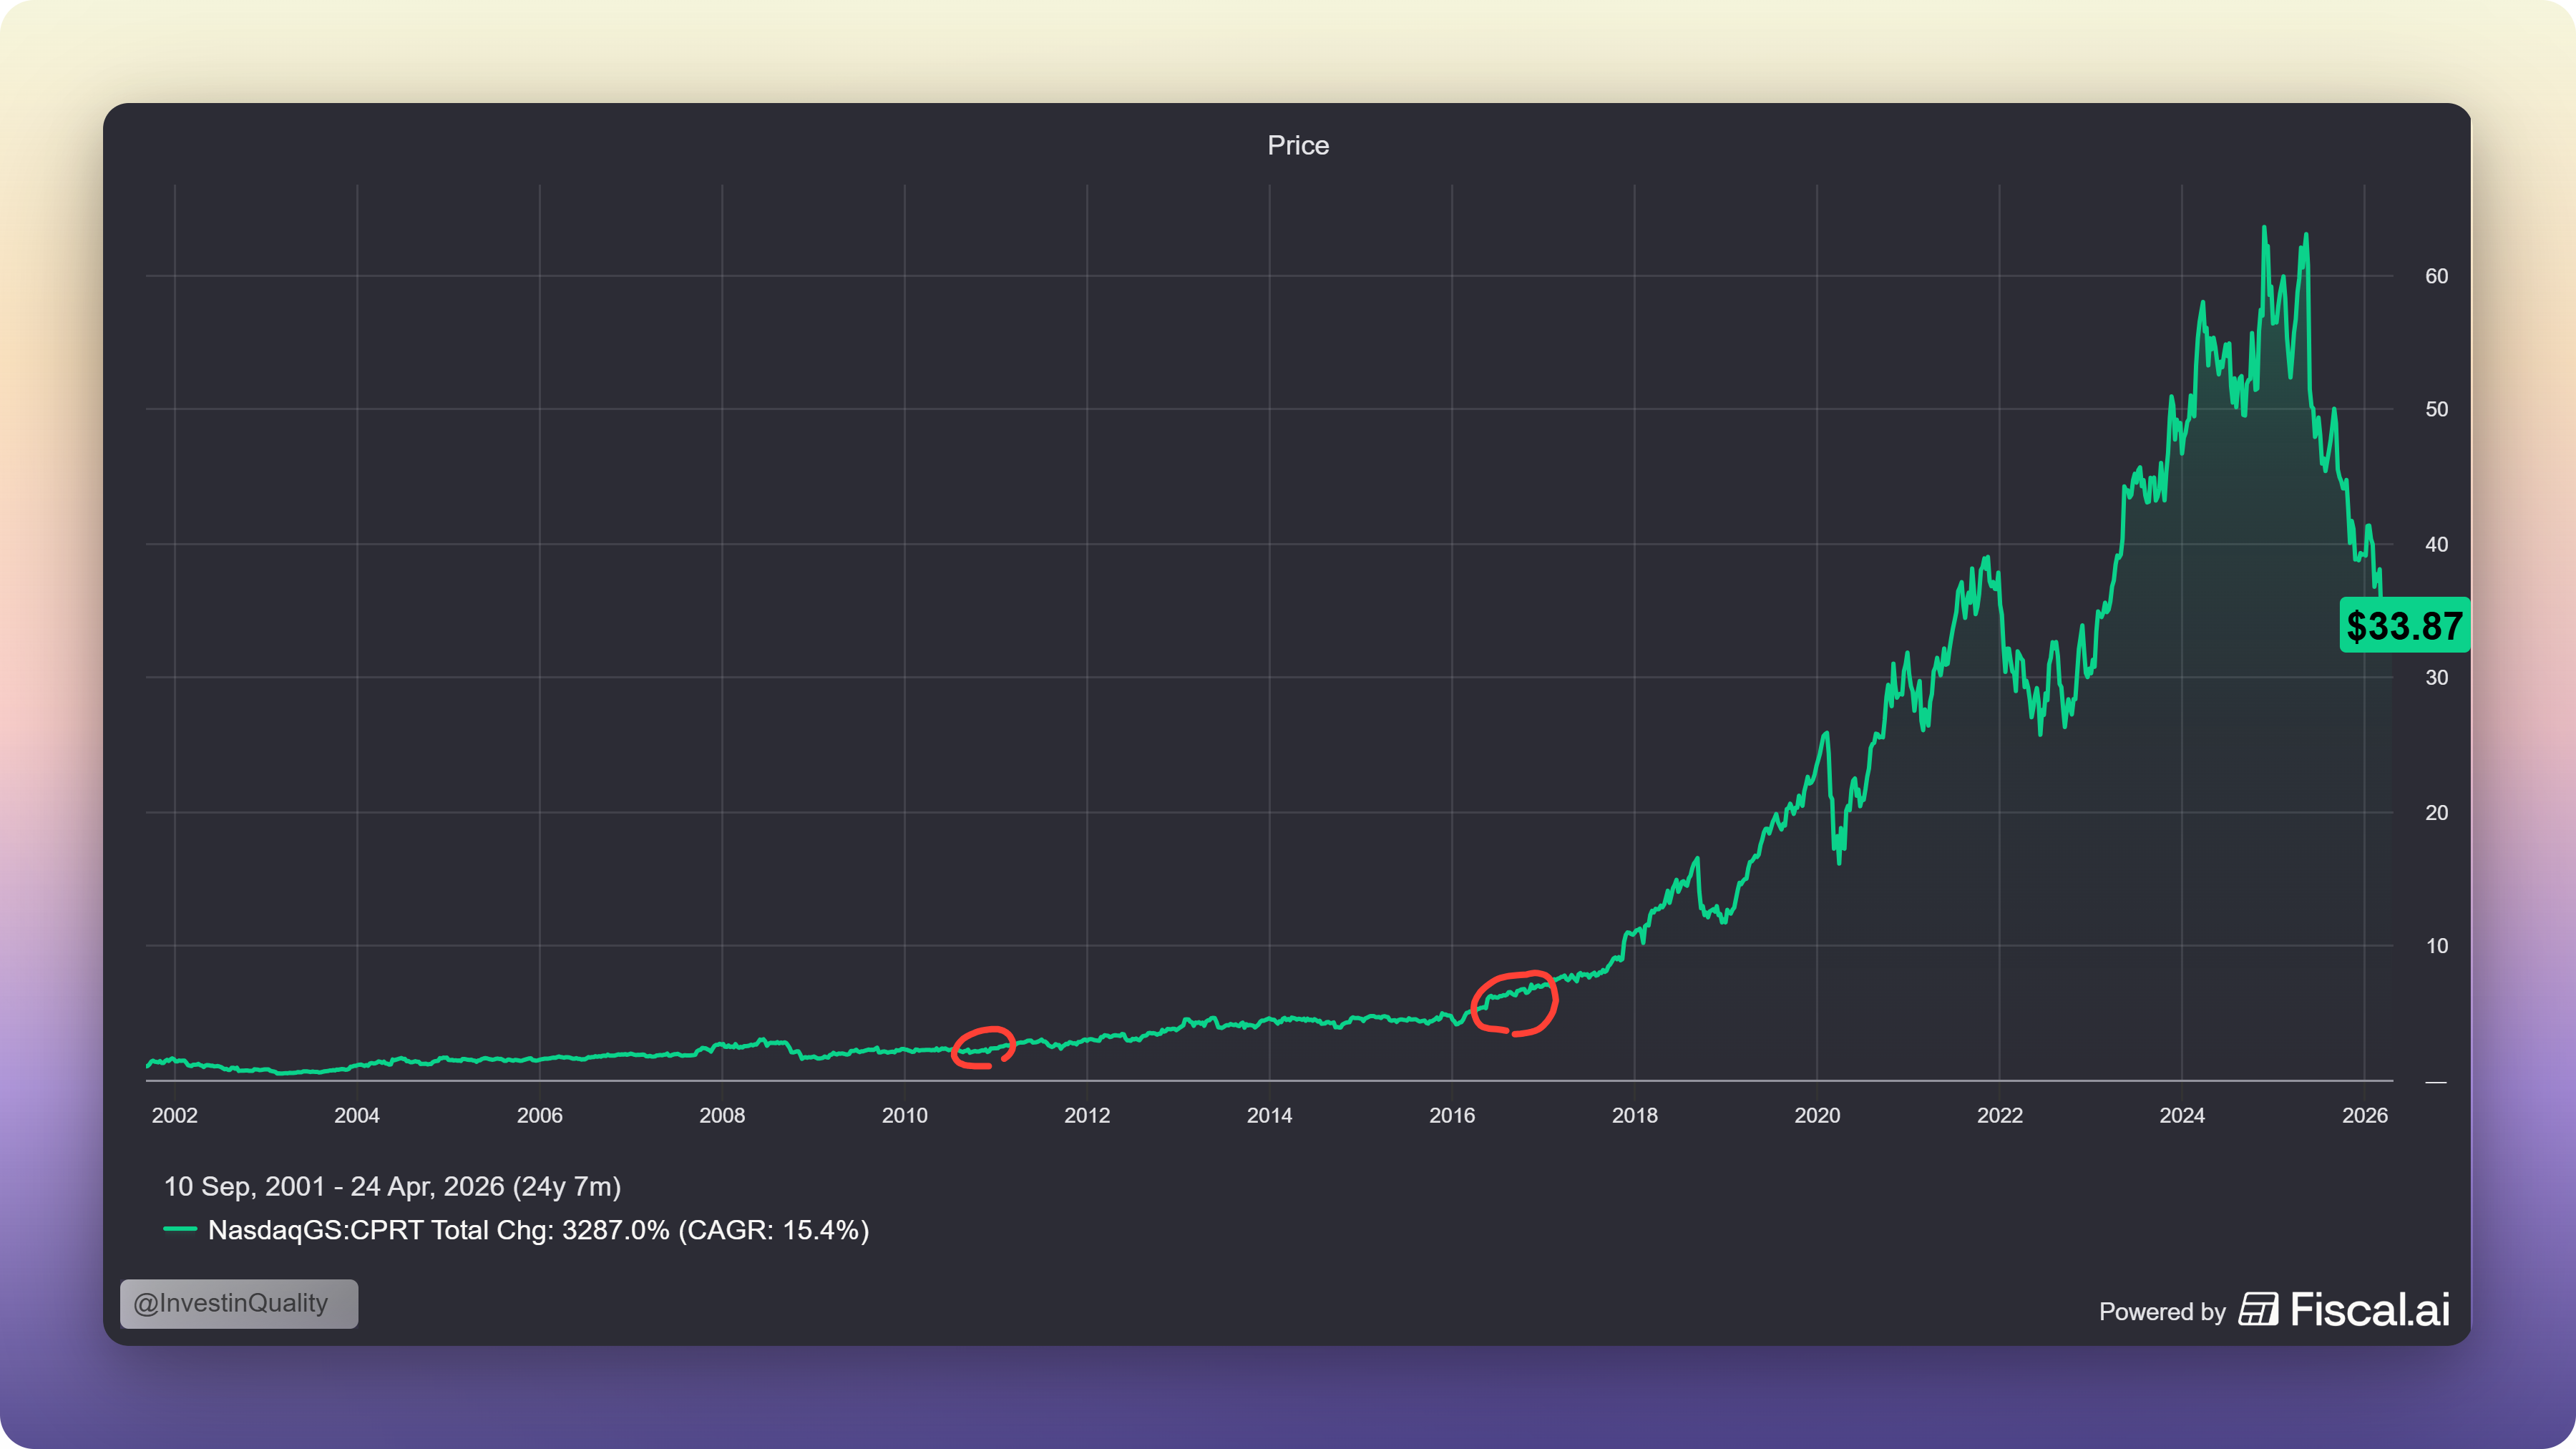
And right now, for the first time in roughly ten years, it’s trading at a 30–35% discount to its long-term average valuation multiples.
The stock is down ~40% from its all-time highs. Two real headwinds have arrived simultaneously. And management just deployed $1.12 billion buying back its own shares in under 90 days.
This is the full breakdown. Let’s get into it. 👇
How Copart makes money
When your car is totalled in an accident and your insurance company decides it isn’t worth fixing, they need to get rid of it. They call Copart.
Copart sends a truck to pick it up, stores it at one of their 250+ yard locations across 11 countries, lists it on their online auction platform, and sells it to the highest bidder. This could be a dismantler in Texas, a rebuilder in Poland, a parts dealer in West Africa, or a mechanic in the Middle East looking for a repairable car.

For this service, Copart charges fees to both the seller (the insurance company) and the buyer. Crucially, they don’t own most of the vehicles, they operate the marketplace on a consignment basis. The seller keeps the proceeds minus fees. Copart keeps the fees.
This model produces economics that would be extraordinary in any industry. In a business that involves physically moving crashed cars around, Copart runs:
42% EBITDA margins
~32% return on invested capital
$1.4B of free cash flow on $4.6B of revenue
$5.1B of cash on the balance sheet with zero meaningful debt
For context, Mastercard, widely considered one of the best business models in the world, runs about 57% EBITDA margins. Copart runs 42% picking up cars from people’s driveways. It is one of the most capital-efficient physical businesses in public markets.
The Moat: A tale of Five Layers
Copart’s moat consists of five layers that create a resilient and sustainable competitive advantage. The five layers compound and build on each other.
1. Physical land ownership
Copart owns the land its salvage yards sit on. More than 250 locations, the majority owned outright rather than leased. Getting a salvage yard permitted near a major metropolitan area takes years of regulatory work, community relations, and capital. You simply cannot replicate this network by writing a cheque. It took Copart four decades to build.
This also explains one of the most interesting strategic moves in recent memory: Copart holds hundreds of acres of otherwise idle land specifically reserved for hurricane-season vehicle storage. That land sits empty, generating zero revenue, until a major storm hits and suddenly becomes the most valuable real estate in the country. No competitor can do this because no competitor has been building this long enough.
2. The digital auction platform, years ahead
Copart moved to an exclusively online auction platform in 2003. Their only real competitor, IAA (now owned by RB Global), was still running physical auctions until COVID forced their hand in 2020. That is a 17-year head start on building a global digital buyer base, an online-first culture, and decades of auction data.

That data advantage matters more than it looks. Every auction outcome: what vehicle, what condition, what buyer, at what price, feeds back into search results, recommendations, and AI-powered tools. A competitor starting today would need years just to replicate the data, let alone the buyer habits.
3. +300,000 global buyers
Copart has 300,000 paying registered members from virtually every non-sanctioned country in the world. International buyers now account for roughly 40% of US vehicles sold and nearly 50% of auction value.
Why does this matter? International buyers pay more. On average, the vehicles purchased by international buyers are 38% more valuable than those purchased by domestic buyers, because they’re shipping them across an ocean, which only makes economic sense for higher-quality vehicles. These buyers pay freight cost, import duties, and logistics, and they do it because Copart’s auction depth gives them confidence they’re getting fair market value.
CEO Jeff Liaw puts it simply: “Liquidity begets liquidity.” More buyers produce higher prices, which attract more sellers, which attract more buyers. Every Copart auction you participate in as a buyer increases the platform’s value for every other buyer. This is a textbook network effect, running inside a business that buys crashed cars.
4. Proprietary data
Copart employs approximately 1,000 engineers, a number that would be notable for a tech company, let alone a salvage auction business. They’ve deployed LLM-powered total-loss decision tools that help insurance carriers make instant total-loss calls from a small sample of vehicle photos. These tools are trained on millions of historical auction outcomes that nobody else has. Two full years into deployment, they’re still expanding.
5. Title Express
When a car is totalled, the insurance company needs to obtain the vehicle title from the bank (if there’s a loan) or the owner. This sounds mundane. It is, in practice, the critical bottleneck that determines how quickly the whole claim resolves.
Copart’s Title Express platform is 5x larger than any competitor’s and delivers cycle times 10 days faster than insurance carriers can achieve on their own. Ten days sounds small. On a ~$15,000 vehicle with daily storage costs, ten days faster means real money saved per claim, multiplied across millions of claims per year. This is the operational advantage that keeps carriers coming back. The one that’s hardest for IAA to replicate because it’s built on scale and purpose-built technology.
Structural Tailwind: Why Cars Keep (And will continue to keep) Getting Totalled
Here is the most important insight about Copart’s business, and the reason this company has compounded for 40+ years despite declining accident rates.
Total loss frequency: the percentage of accident-involved cars that get written off rather than repaired has been rising relentlessly for four decades:
Year Total Loss Frequency according to CCC Crash Course 2026 report:
1980 ~4%
1990 ~5%
2000 ~10%
2015 15.6%
2025 23.1%
That’s a nearly 6x increase since 1980, and the trend shows no sign of reversing. The CCC 2026 Crash Course report documented record 23.1% total loss frequency for full-year 2025, with Copart’s management citing 24.2% for Q4 2025 specifically.
Why does this keep happening?
Modern cars are extraordinarily sensor-dense. Every bumper has radar. Every A-pillar has a camera. Every headlight assembly has adaptive motors and alignment sensors. CCC data shows that 28.3% of all repairable estimates in 2025 required at least one sensor calibration, up from 21.8% just a year prior. On insurance-company-approved repair estimates specifically, the calibration rate was 35.6%.
The math is simple: if your front bumper gets hit at 15 mph, the repair used to cost $1,200. Now it costs $2,800 because the radar module in that bumper needs recalibration, reprogramming, and verification. At some point, that repair cost exceeds the car’s value, and the carrier writes it off as a total loss. More complexity = higher repair costs = more total losses. And cars only get more complex.
The average US light vehicle was 12.8 years old in 2025. Older cars have lower actual cash values, meaning even modest repair estimates push them over the total-loss threshold.
Electric vehicles make this worse. EVs are sensor-heavy at the perimeter. Any damage that involves bumper-mounted sensors, battery integrity concerns, or charging systems can quickly make repair uneconomical. Jeff Liaw said on the Q4 2025 call: “They total, if anything, more easily.”
The crucial distinction: accident frequency has declined every year for 40+ years thanks to ADAS and safer road design. But total loss frequency has risen 5x over the same period. The total-loss trend has overwhelmed the accident-frequency trend every single year of Copart’s existence as a public company. Liaw’s long-term forecast:
“We’ll reach 25% and we’ll reach 30%.” The current reading is 24.2%. He’s not projecting something extraordinary, he’s extrapolating a 40-year trend.
So Why Is the Stock Down 40%?
Two headwinds have arrived at the same time, and they’ve been brutal to the reported numbers.
Headwind 1: The underinsurance cycle
Auto insurance premiums rose 17% in 2024 and 7.6% in 2025 as carriers recovered from a brutal claims-inflation period. Consumers responded rationally: they dropped coverage.
The Insurance Research Council found that 33.4% of US drivers are either uninsured or underinsured. This is a 10-point increase since 2017. More starkly, earned car years (active collision policies) fell 4.1% YoY in Q2 2025, even as the actual vehicle fleet grew 1.4%.
That 5.5-point wedge between active policies and vehicles on the road is the underinsurance cycle. When a driver without collision coverage has an accident, the car doesn’t go to Copart, it ends up scrapped, retained, or sold privately. Copart’s US insurance unit volumes fell 9.5% in Q1 2026 and 10.7% in Q2 2026.
This is a cycle, not a structural shift.
Carrier profitability is now at a multi-decade peak. Progressive earned $11.3B in 2025. Allstate earned $10.2B. State Farm earned $12.9B (more than double the prior year) and announced a $5B policyholder dividend alongside rate cuts in 40 states averaging roughly 10%. When carriers cut prices, coverage becomes affordable again, earned car years recover, and salvage volume follows with a 6–12 month lag. We appear to be at the beginning of that cycle today.
Headwind 2: The Progressive/IAA volume shift
Progressive is the fastest-growing major US auto insurer of the past decade. It has been shifting a larger portion of its salvage volume to IAA (Copart’s competitor). Sell-side estimates suggest IAA’s share of Progressive’s salvage business moved from ~75% to ~90% during 2025. Since Progressive represents roughly 15% of the US auto insurance market, this shift amounts to an estimated 50,000–70,000 annualised unit headwind for Copart.
Management won’t say “Progressive” on earnings calls, careful not to escalate a dispute with a customer they presumably want back. But Liaw’s language in Q2 2026 earnings call gave it away: “We may be in a uniquely or unusually Copart adverse moment in time in that respect… but over the long haul we view those trends as often more cyclical than they are secular.”
The net result of both headwinds together: the headline numbers look terrible. Revenue down 3.6% in Q2 2026. EPS below consensus. Unit volumes down 8–10%. The stock has been punished.
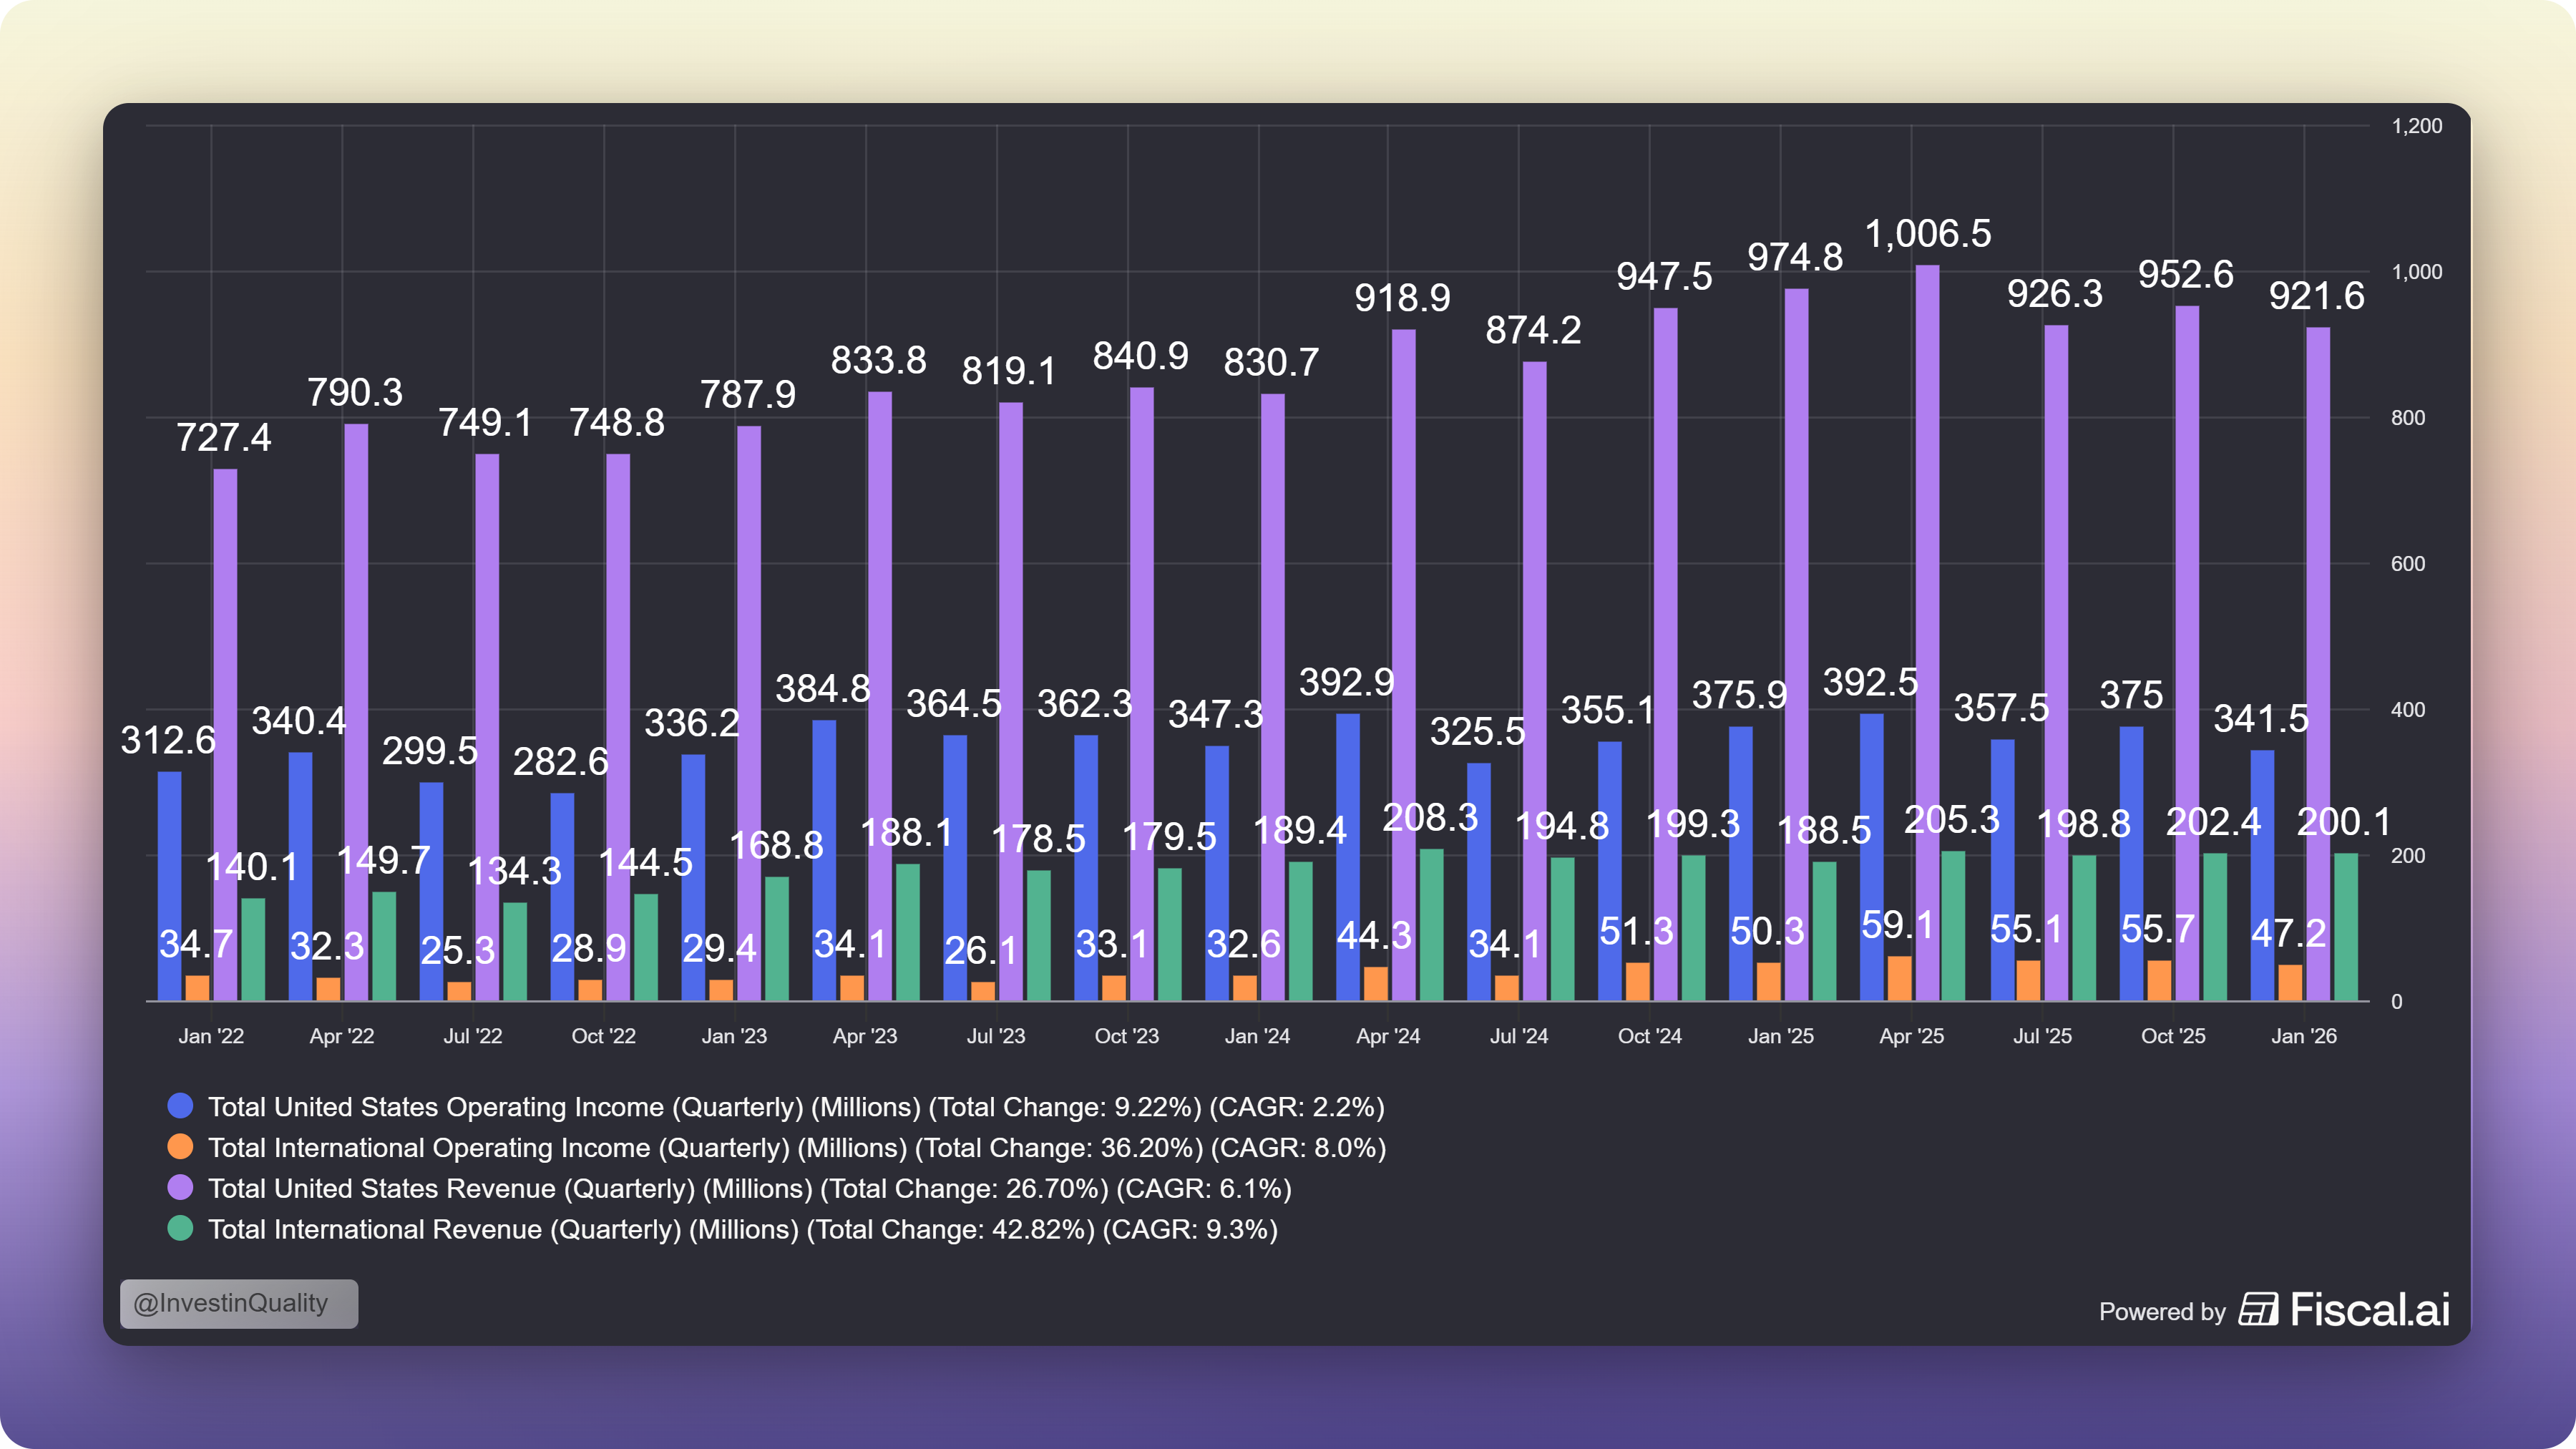
The market is always forward looking, but the last 17 quarters have seen OK growth despite the recent headwind to unit volumes.
The Fundamentals
Despite the volume headwinds, the underlying financial quality has been remarkable.
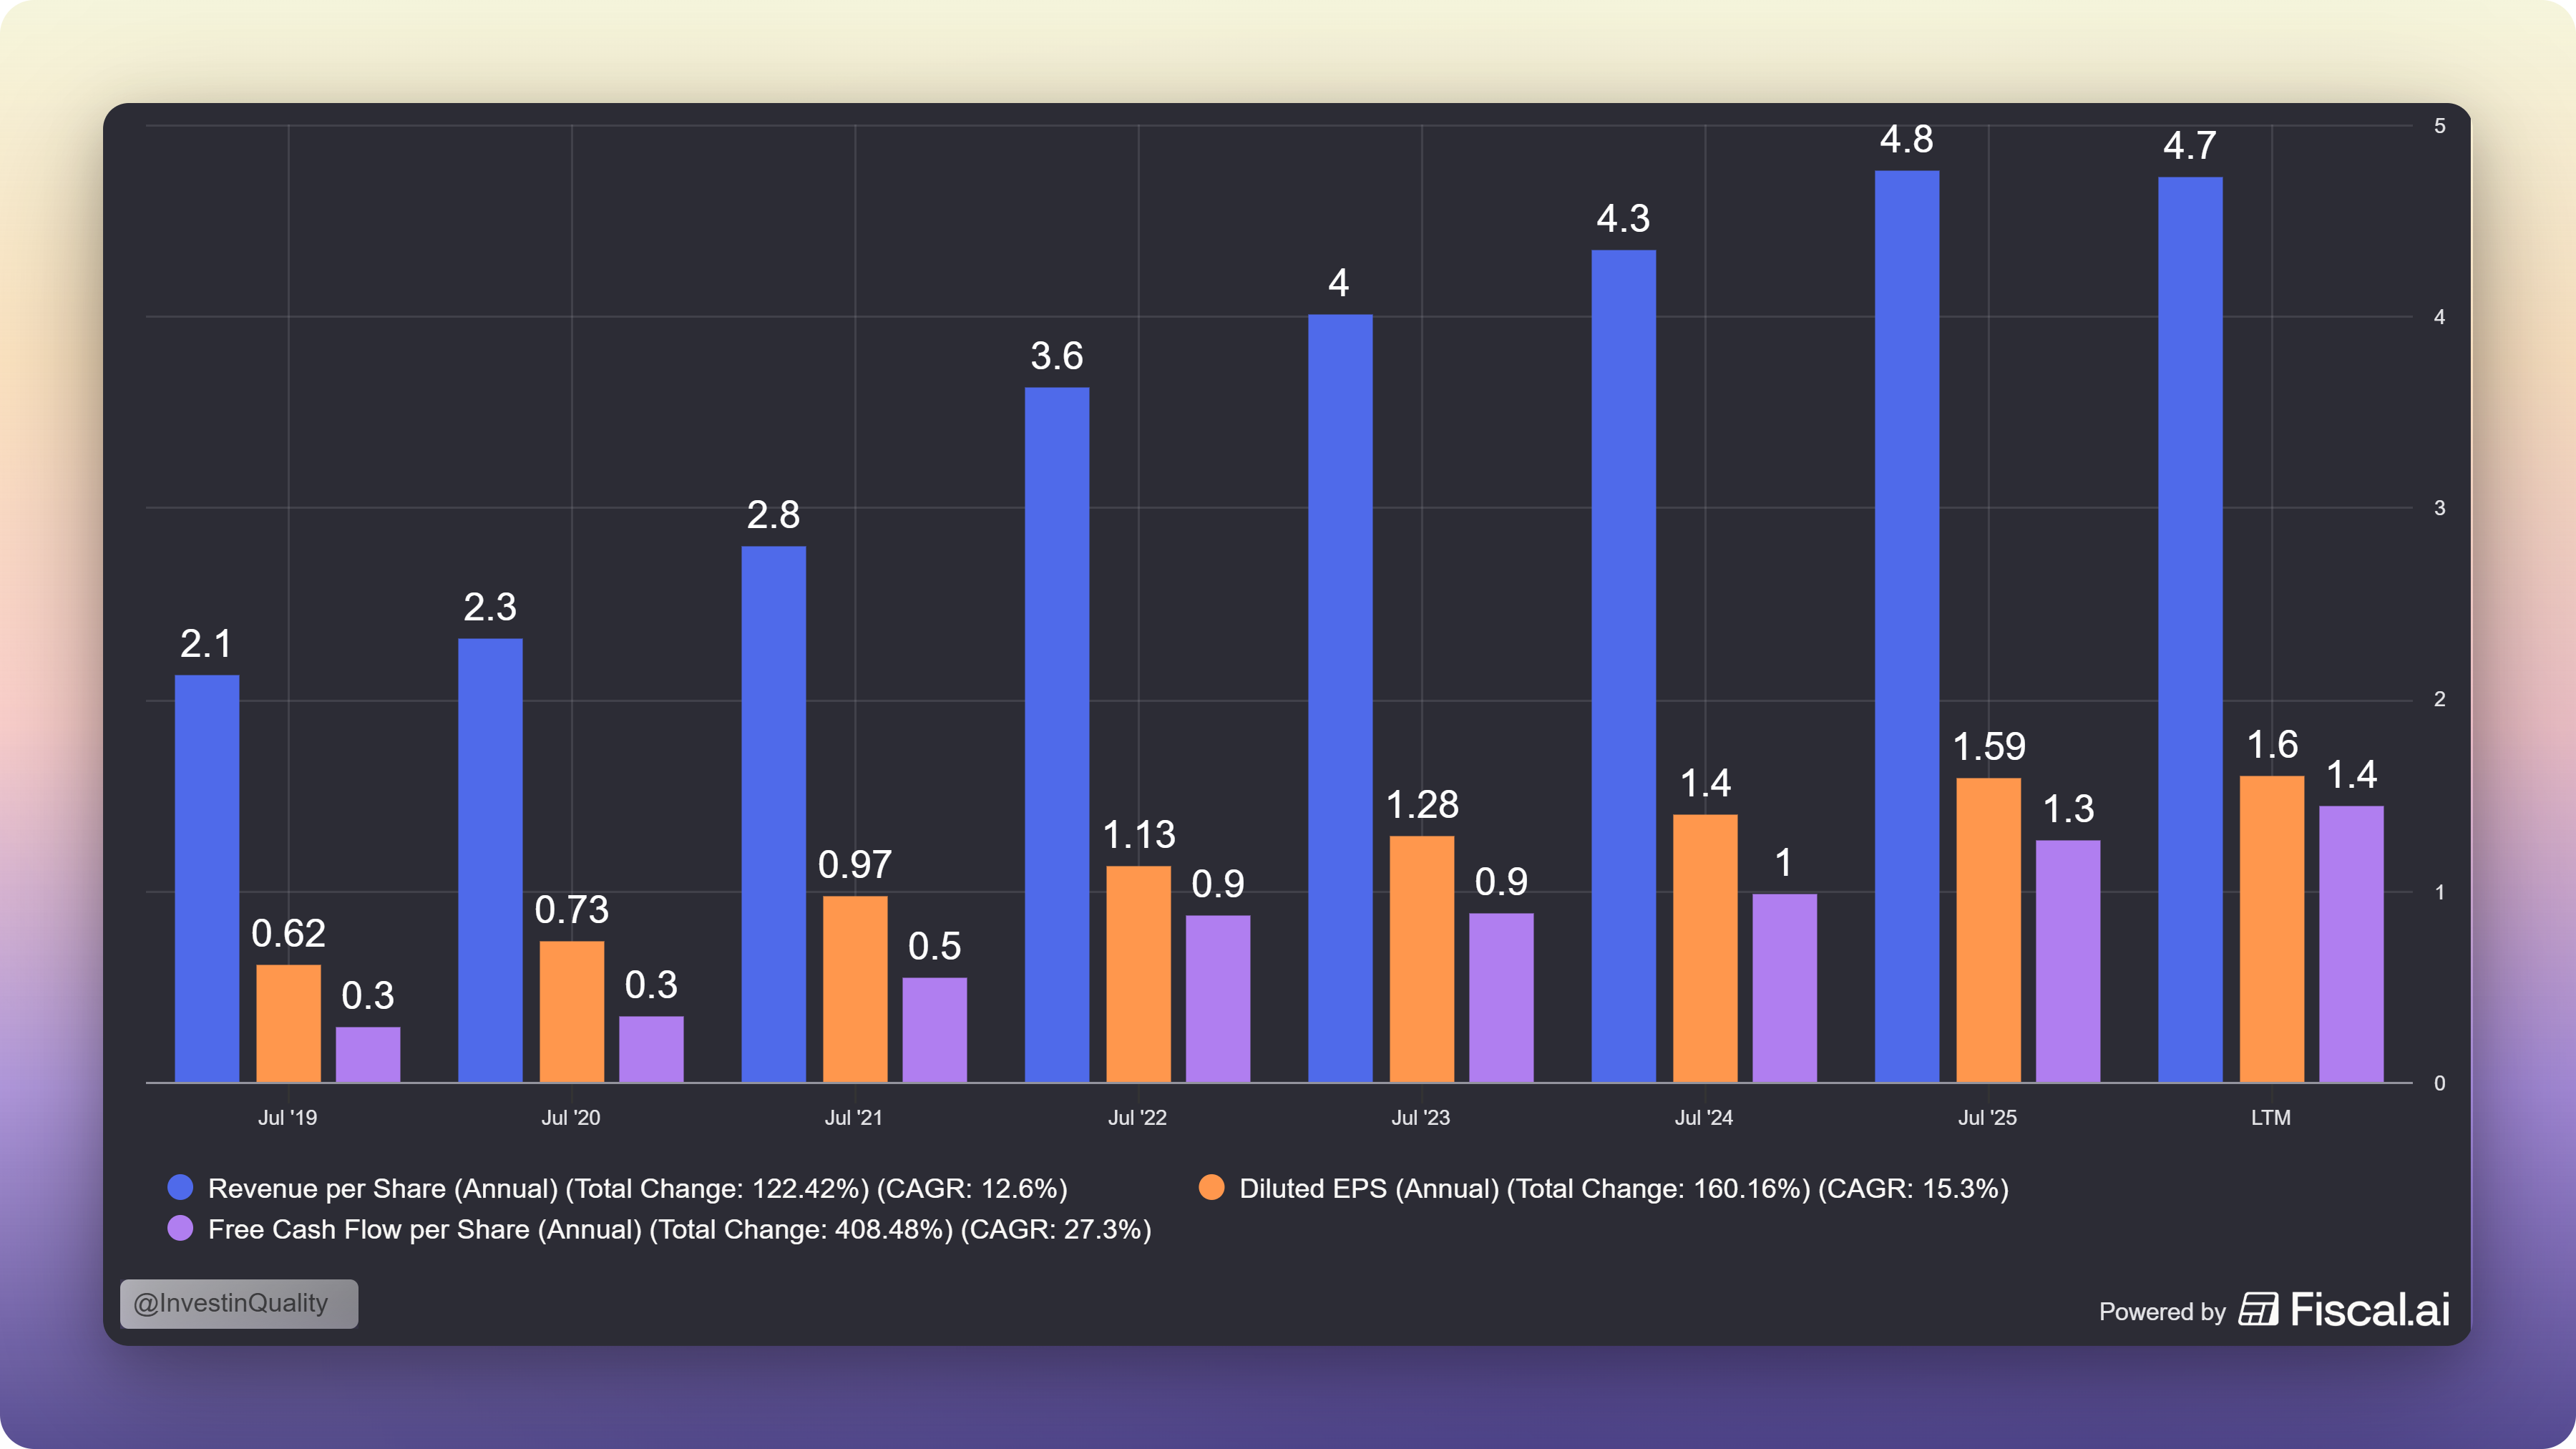
Revenue, earnings and free cash flow per share since 2019:
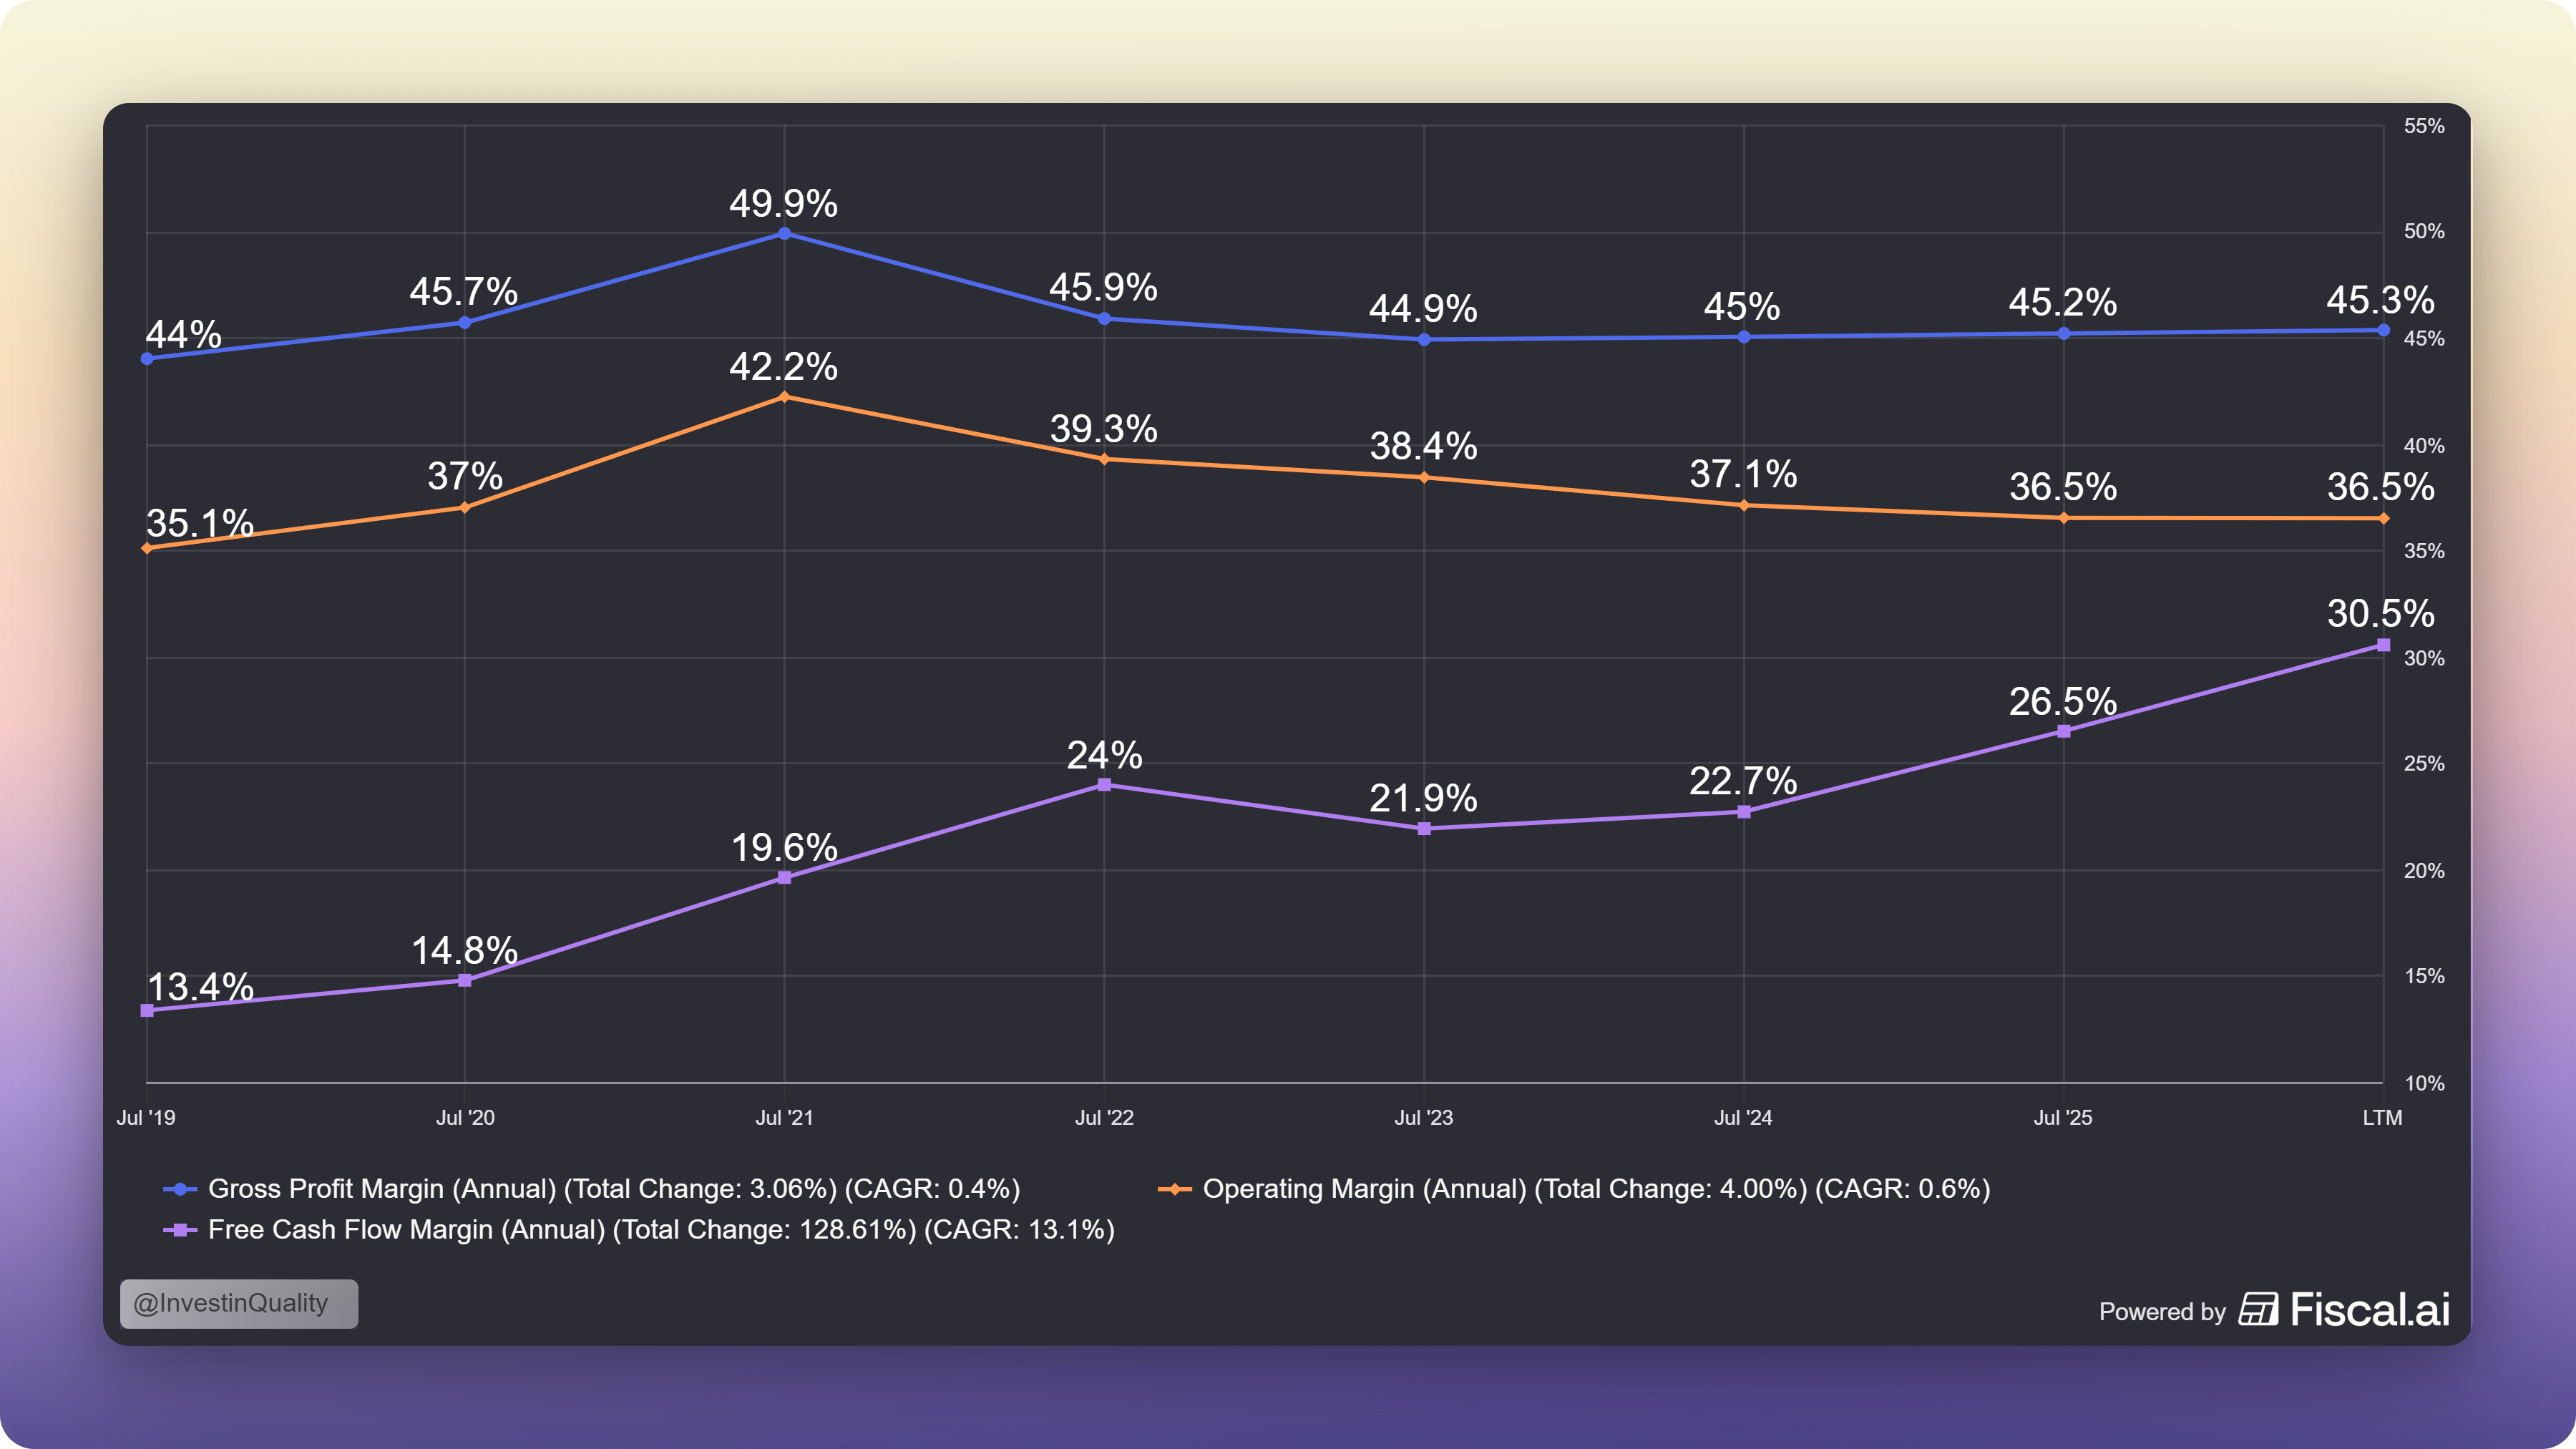
Gross, operating and free cash flow margins remain robust, FCF margins have expanded significantly since 2023:
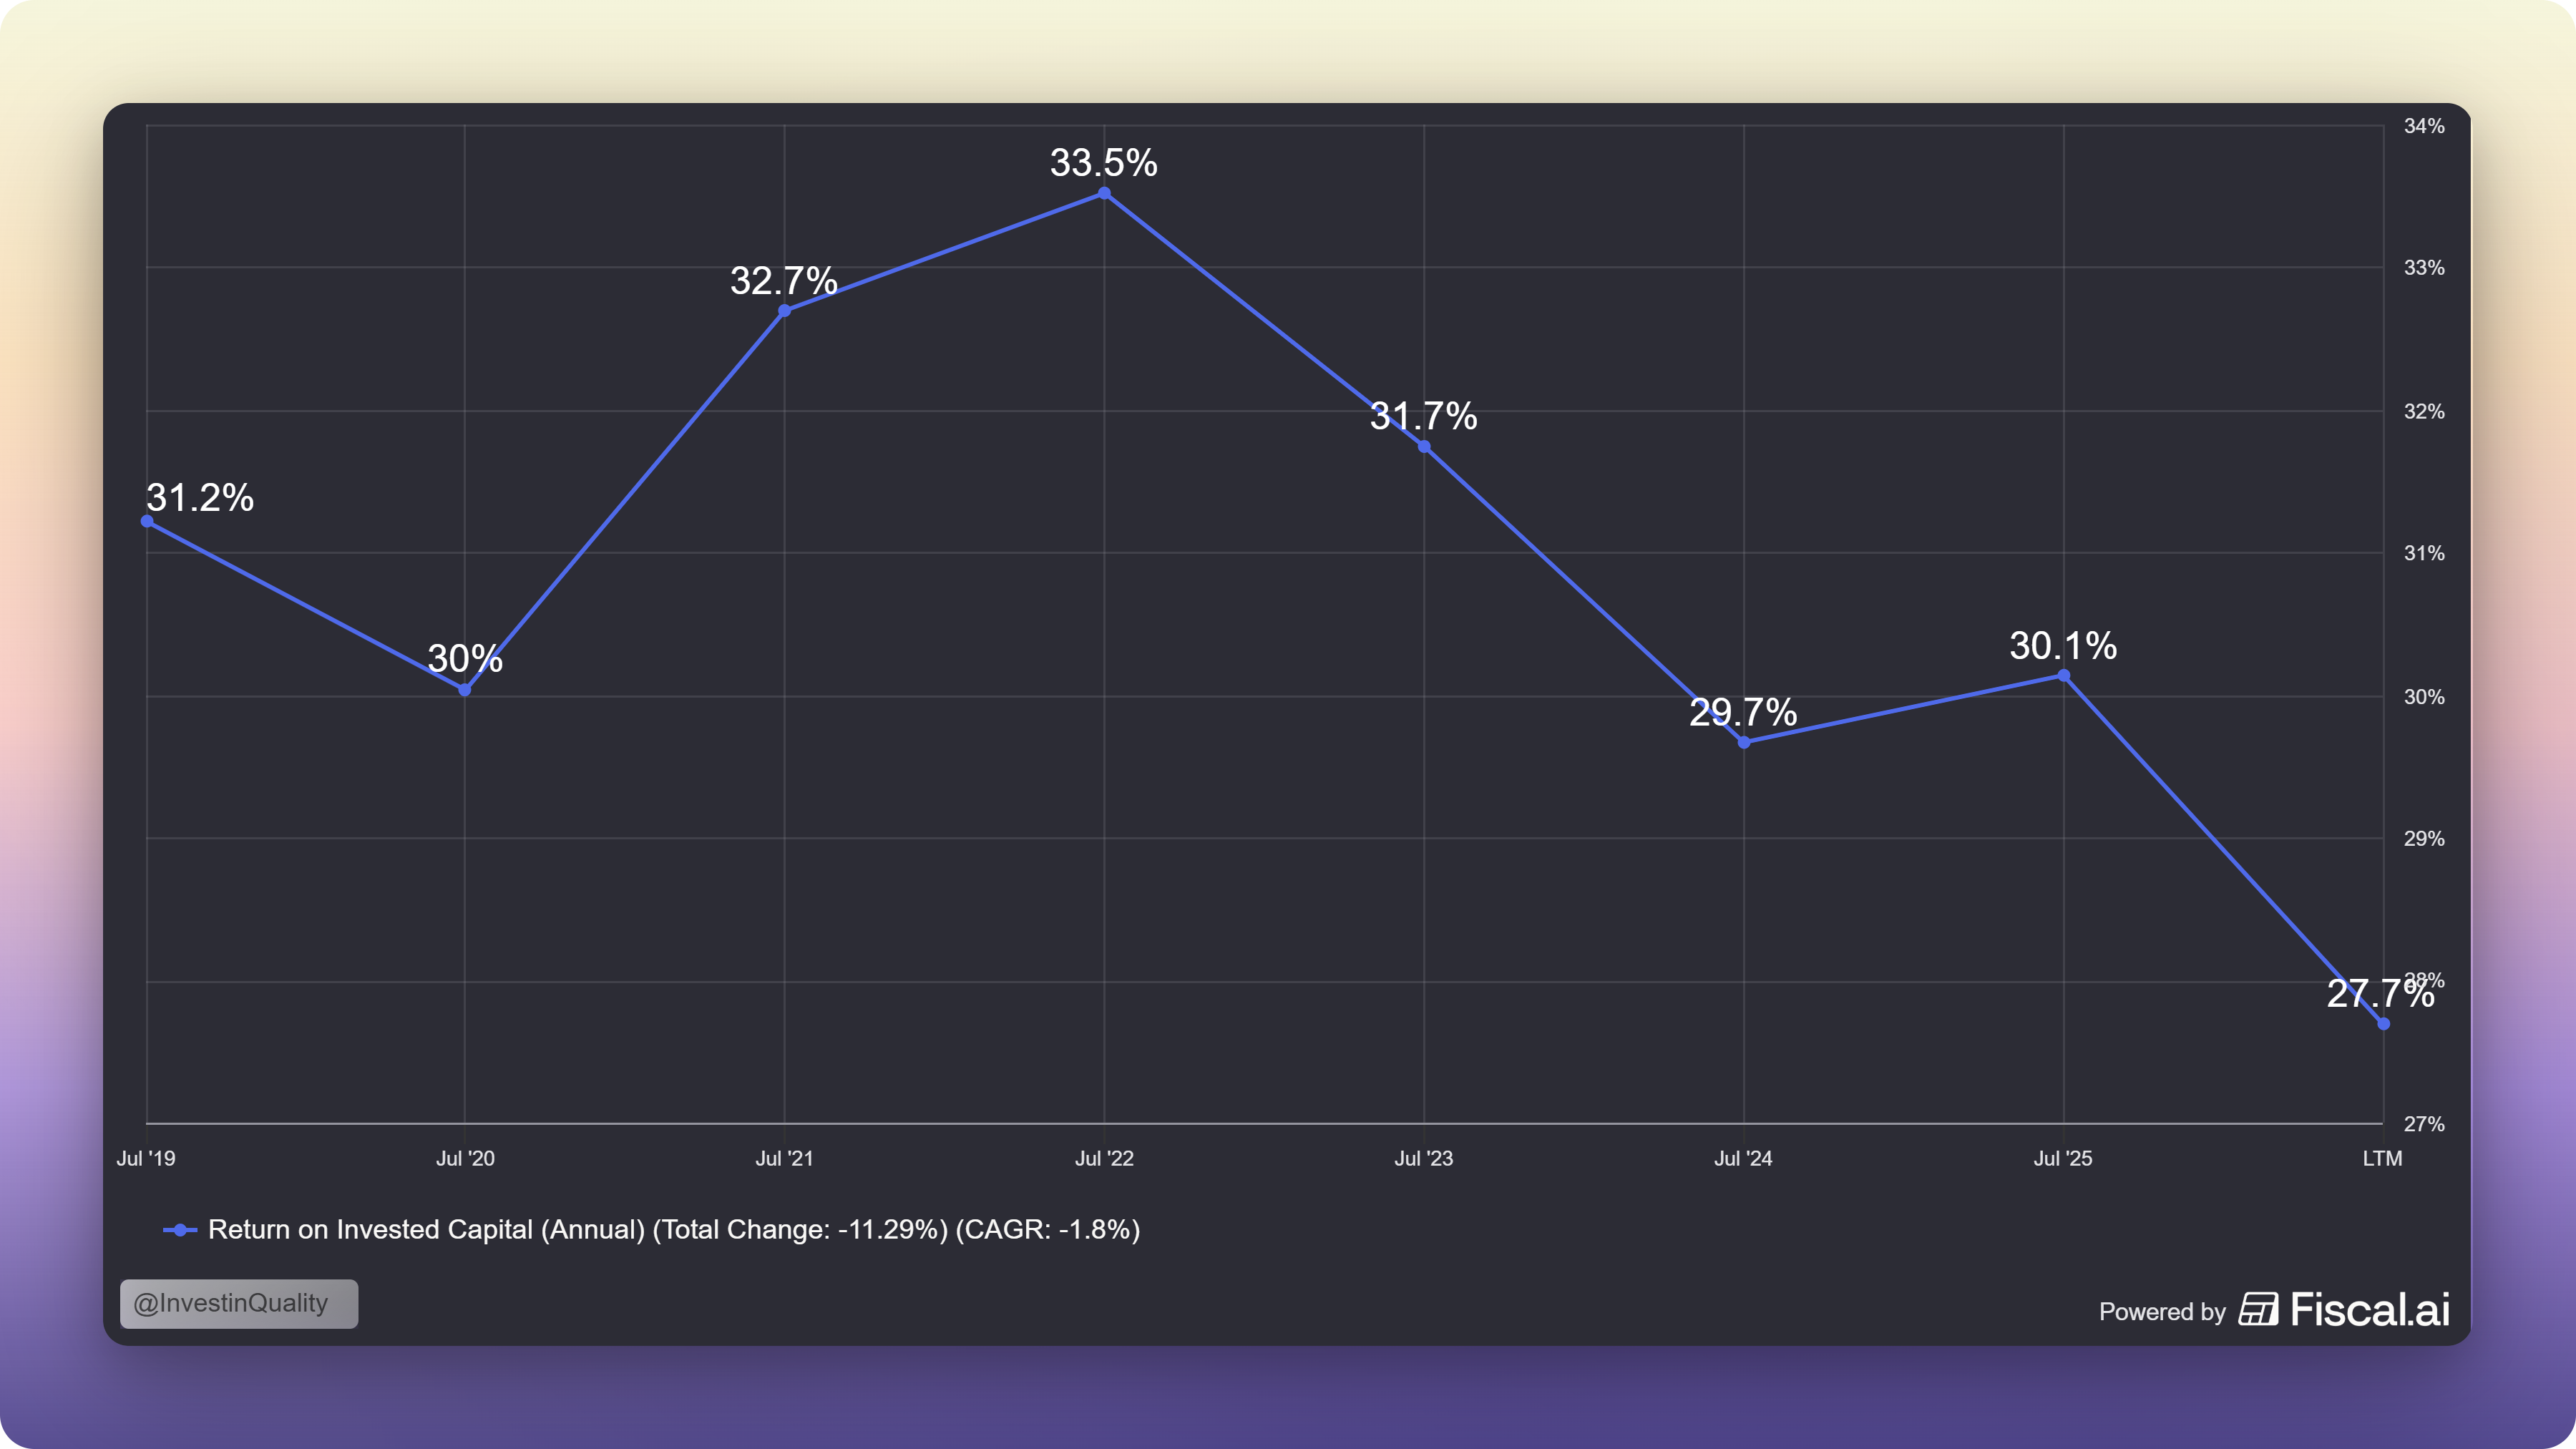
Return on invested capital is consistently above 25%, but the decline since 2022 is something investors should monitor over time:
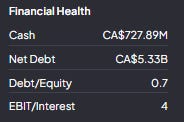
The balance sheet is extraordinary:
Cash: $5.1B
Debt: effectively zero
Total liquidity: $6.35B (including a new $1.25B undrawn revolver signed January 2026)
Stockholders’ equity: $9.79B
This is one of the cleanest balance sheets in the S&P 500 for a company of this size.
Low debt levels create more room for flexibility and making good capital allocation decisions in down cycles. And the management team has proven its prudence for capital allocation in the past.
The Competitive Landscape
Copart operates in a genuine duopoly for US insurance salvage auctions. Its only real competitor is IAA, now owned by RB Global following a $7.3B acquisition that closed in March 2023.
That acquisition was messy. Leverage spiked to 3.0x. There was CEO turnover. Integration costs were significant. But RB Global has stabilised. Leverage is still high, but manageable (Although not something we would invest in):
Here’s where the valuation comparison gets interesting — and somewhat baffling:
RB Global trades at a forward PE of 23.6x
Copart trades at a forward PE of 20.8x
RB Globals 5 year average ROIC is 7.1%
Copart’s 5 year average ROIC is 31.6%
RB Globals long term EPS growth estimate is 10%
Copart’s long term EPS growth estimate is 15%
RB Globals interest coverage is 4.1x (Not good)
Copart’s interest coverage is infinite (No debt, no interest payments)
Cheaper valuation, higher return on invested capital, higher future growth estimates, and no debt compared to high debt levels…
In plain English: Copart is trading at a lower multiple than its more levered, lower-quality, lower growth competitor.
The only explanation is momentum. RBA is improving from a messy base. CPRT is declining from a pristine one. The market is paying for direction-of-change, not quality of business. That mispricing tends not to last.
Management: What The Buyback Actually Tells You
Jeff Liaw, who became sole CEO in April 2024, is worth paying close attention to. His earnings call language is intellectually rigorous, unusually specific, and direct about uncertainty in a way that most public-company management teams are not.
But what matters most right now isn’t what Liaw says, but what Copart does.
For nearly three full years (2023, 2024, 2025, and Q1 2026) Copart repurchased zero shares while cash built from $1.8B to $5.1B. The inaction looked strange for a company sitting on a mountain of cash.
Then, in under 90 days:
November 2025 – January 2026: 5.48M shares repurchased for $218M at ~$39.82 average
February 1 – March 2, 2026: 24.26M shares repurchased for $899M at ~$37.11 average
Total: 29.7M shares, $1.12B deployed, at a blended average of $37.60
Liaw’s characterisation of the timing on the Q2 2026 call: “There’s no particular witchcraft or anything magical to it. I think it’s a function of what general valuation multiples are and where interest rates are, our own views of Copart’s relative valuation.”
No witchcraft. Just management deploying 22% of its entire cash balance to buy back stock at the cheapest valuation in a decade, after doing nothing for three years when the stock was at $50–$60.
This is exactly how great capital allocators behave. Copart did massive buybacks in 2011 (29% of shares outstanding) and 2016 (12% of shares outstanding):
Both times, the stock subsequently compounded dramatically.
Willis Johnson, the founder who still owns ~74 million shares worth ~$2.5B, built a culture of treating each dollar as precious, and buying back stock only when the math is clearly in shareholders’ favour.
The message from this buyback is unambiguous: management believes the stock at $34–38 is materially undervalued relative to their internal estimate of intrinsic value.
Valuation: Multi-Year Lows
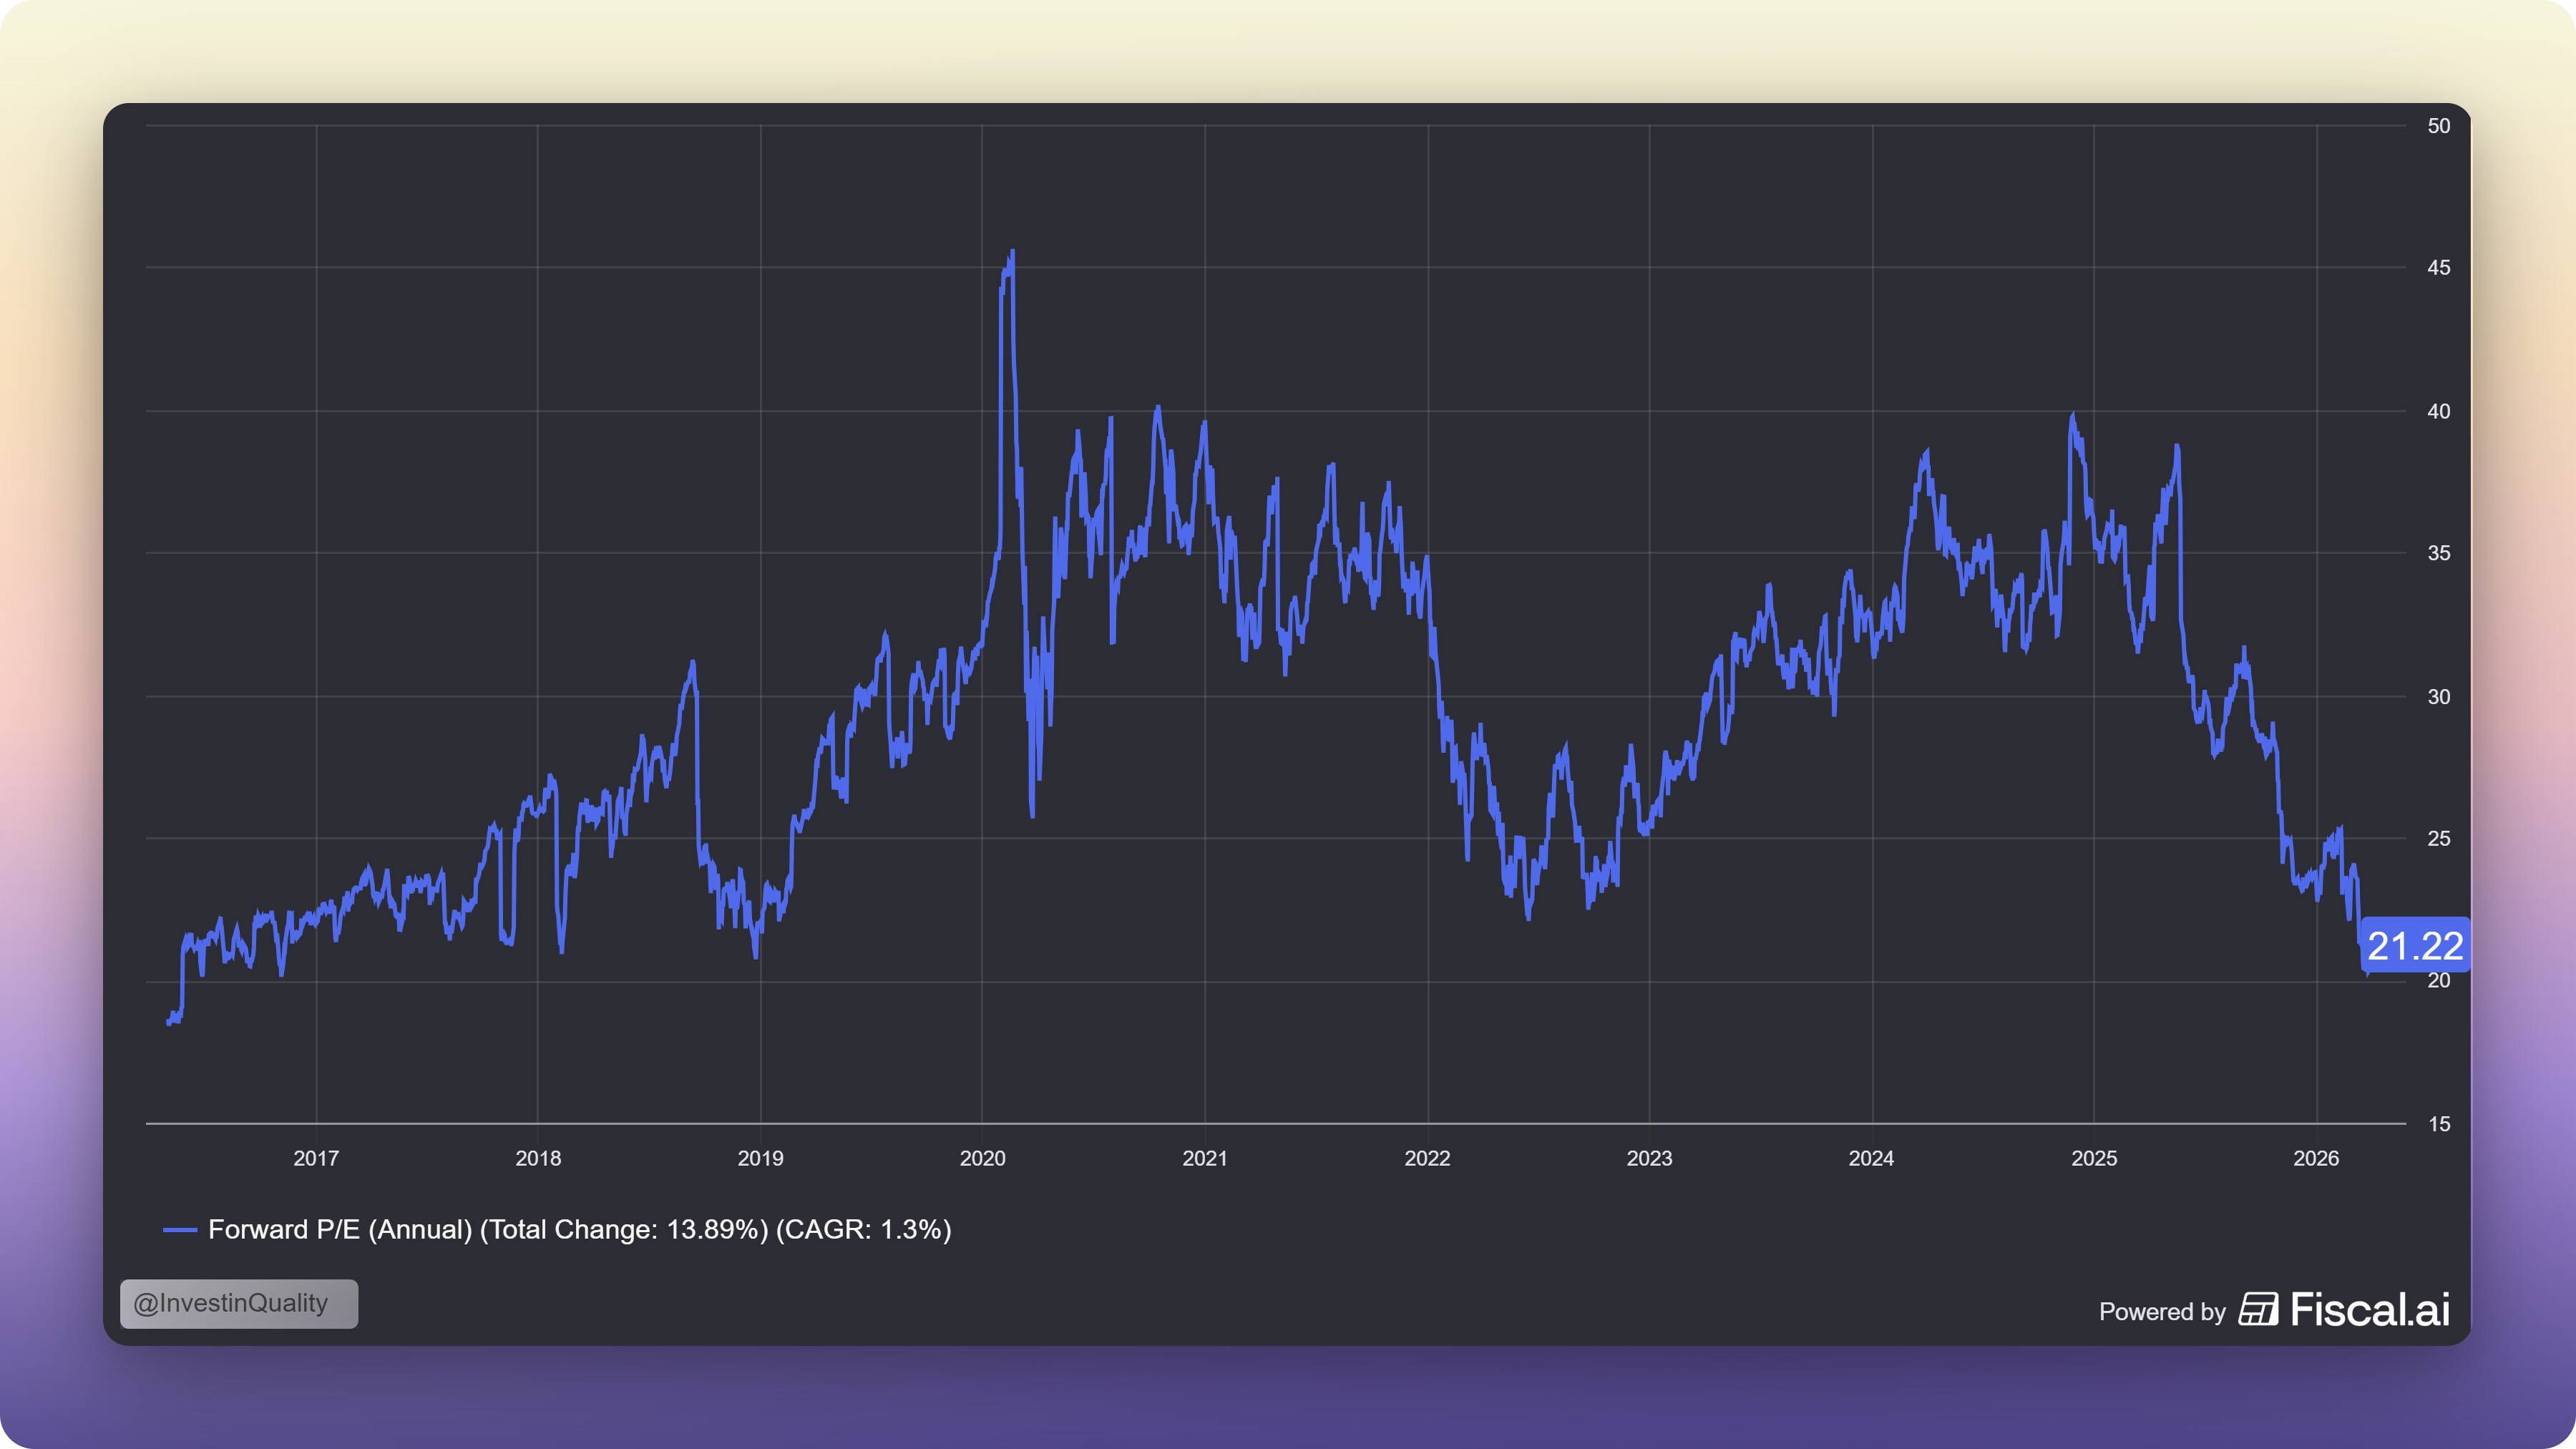
At $33.87, here’s where Copart trades against its own history:
Copart currently trades at 21.22x forward PE, not seen since 2017:
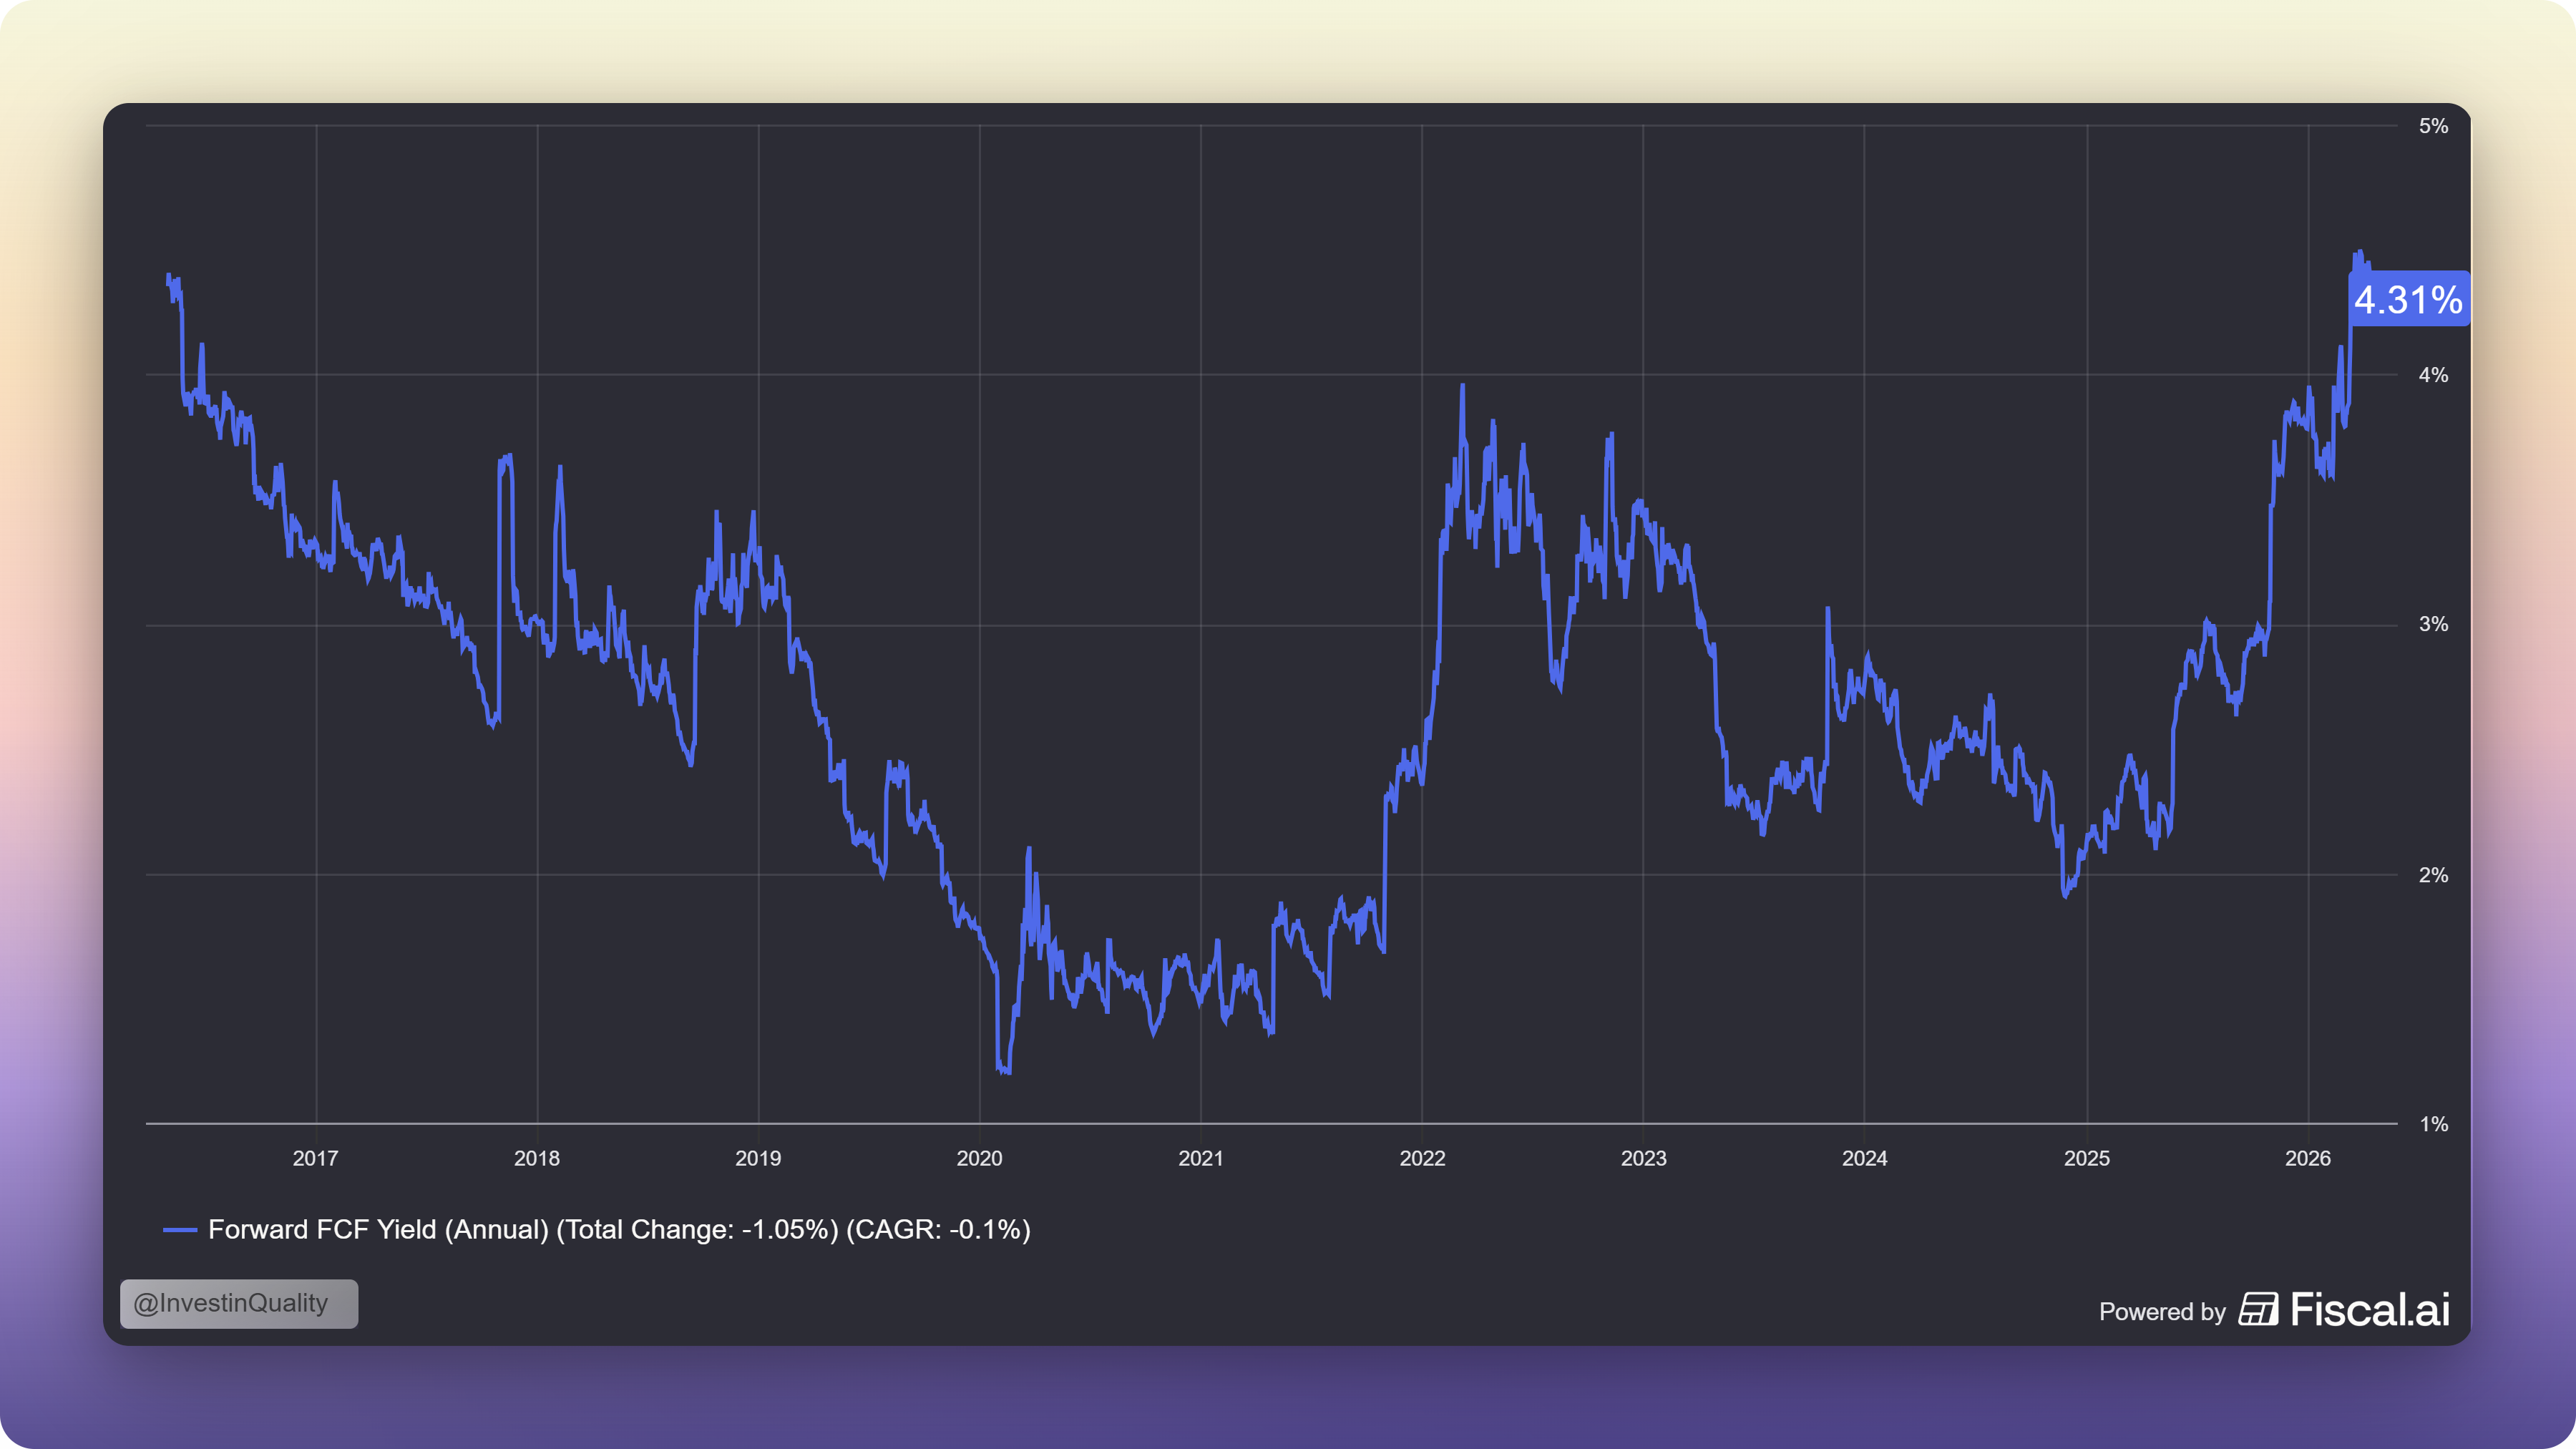
Free cash flow yields are also trading at the highest since 2017:
This is a 30–35% discount to long-term averages. Copart last traded at these multiples in 2017. Before that, briefly during the 2008–2009 financial crisis. In 32 years as a public company, this is the deepest non-crisis multiple compression Copart has ever experienced.
The market is implying, through this multiple, that Copart will grow revenues at roughly 2.5–3.5% annually with flat margins. Given a business that has compounded at 10%+ every rolling three-year period since 2003, a 300,000-member global buyer network still expanding, and a structural total-loss-frequency trend that has beaten expectations every year, the market’s implied growth rate looks about half of what this business demonstrably delivers over time.
Three 18-month valuation scenarios:
Bull case $55–65:
Unit volumes inflect positive in Q3–Q4 2026 as carrier rate cuts restore coverage. Progressive allocation partially reverses. Buybacks reduce share count 7–10%. 2027 EPS of ~$2.10–2.20 at 28x = $58–62.
Base case $44–50
Modest volume recovery. Progressive shift stabilises. Margins hold at 41–42%. Buybacks provide EPS floor. 2027 EPS of ~$1.85–1.95 at 24–26x = $44–50.
Bear case $25–30
Progressive loss proves structural. Underinsurance persists. DOJ settlement costs $300–500M. Margins compress. 2027 EPS $1.50–1.65 at 18–20x = $26–30.
That is the short term scenarios, here are the three long-term scenarios for Copart:
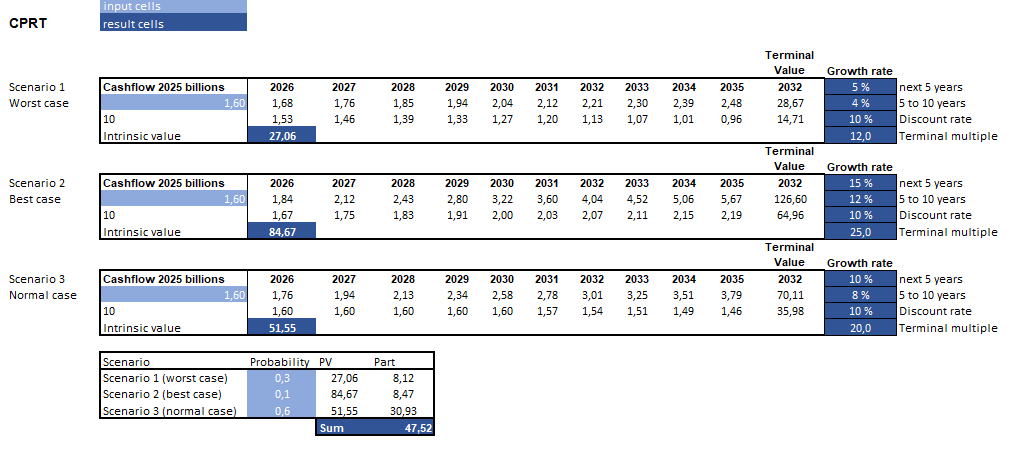
Long-term value estimate: $47.52
Current price: $33.87
Upside: +40.3%
CAGR potential: +17.5%
The buyback math alone is meaningful
At a cumulative $2.5B deployed at ~$38, the share count falls roughly 6.7%. Applied to base-case 2027 EPS, post-buyback earnings per share would be approximately 7% higher than pre-buyback. That turns a flat-EPS year into a growth year and puts a hard floor under the stock.
Analyst consensus price targets range from $32 (Barclays, Underweight) to $62–65 (HSBC and CFRA, Buy/Strong Buy). Consensus sits around $44–48. Everyone agrees the stock is cheap relative to the business quality, the debate is purely about whether volumes recover.
What Could Go Wrong?
No breakdown is complete without an honest risk assessment.
The underinsurance cycle could be slower to reverse than expected. Carrier rate cuts in 40 states are happening now, but the lag from rate filing → policy in force → accident → salvage consignment is 6–12 months. If macro conditions worsen and drivers prioritise other expenses over reinstating coverage, the salvage pool recovery could be delayed by another 12–18 months.
The Progressive/IAA shift may be partly structural. IAA has genuinely improved its service metrics post-acquisition. Part of this volume shift likely reflects real carrier-level preference for two-vendor redundancy — not just IAA’s improved execution. It probably doesn’t fully reverse. We size the sustained headwind at 1.5–2.5% of Copart revenue over the next 24 months.
The DOJ investigation is an unresolved overhang. Since October 2023, Copart has disclosed a DOJ letter related to potential money-laundering control violations in its buyer-onboarding processes. As of March 2026, there’s no update beyond boilerplate. Based on comparable enforcement cases, we estimate a likely settlement in the tens-to-hundreds of millions. This is real but not balance-sheet-threatening. But “we don’t know” is the accurate answer.
Long-duration ADAS risk. Over a 20-year horizon, if autonomous vehicles genuinely achieve mainstream adoption, accident frequency could decline sharply enough to offset rising total-loss frequency. Liaw’s response to this on Q4 2025 was honest: “At this point, a de minimis effect.” The fleet-turnover math (16M new vehicles into 289M VIO) suggests this wouldn’t show up materially for decades even in a scenario where fully autonomous vehicles succeed. But it’s a real tail risk.
The Investment Case Summarized
Copart is a duopoly infrastructure business with 41.2% EBITDA margins, 31.6% ROIC, $5.1B of net cash, and a structural tailwind (rising total loss frequency) that has compounded for 40 straight years.
Today it trades at 20.8 forward PE, this is a 30% discount to its 10-year average and a discount to its lower-quality competitor (RB Global). Two cyclical headwinds (consumer underinsurance and one large carrier’s volume shift to IAA) are real, but most likely temporary.
The company’s management (with deep insider ownership and a 40-year track record of disciplined capital allocation) just put $1.12 billion of the company’s own money into buybacks at $37.60 after not buying a single share for three years.
The one question that matters: is the unit-volume weakness a cycle or a structural break? The 40-year total-loss-frequency trend, the all-time-high auction quality metrics (bidder count, pure sale rate, gross returns), and the insurance carrier profitability setup all say it’s a cycle.
At $33.87, you’re being offered one of the highest-quality business models in the US market at a price the company’s own management believes is cheap.
Whenever you are ready, this is how I can help you:
Go Premium to access exclusive content & follow our market-beating Quality Growth portfolio. Read more here.
Essentials of Quality Growth — Join more than 300 investors who have bought the guide. Essentials of Quality Growth Investing is a multi-step guide for building a stock market portfolio of 10-20 high-performing quality compounders.
(Free) Valuation Cheat Sheet — Learn an easy and reliable method of valuing a business. Learn how to set a margin of safety for your investments.
(Free) How to identify a compounder — Learn how to effectively look for great companies that you can buy and hold for the long term.
(Free) How to analyze the financial statements — Learn how you read & analyze the balance sheet, income statement, and cash flow statement.
Promote yourself to +25.000 stock market investors (42% open rate) — Contact us via: investinassets20@gmail.com
https://thesisrationale.substack.com/p/copart-when-a-strong-moat-meets-a?utm_campaign=post-expanded-share&utm_medium=post%20viewer
This are our analysis on CPRT, would love to exchange ideas or opinions. This is a good company.