
Be a Stock Market Sniper 🎯
How to better time entries into great companies 🧠

Hi investor 👋🏻
Merry Christmas to those who celebrate! 🎅🏻🎄🎁
One idea in investing that is under-communicated, is the importance of patience when taking a new position.
Using a dollar cost average can be an OK strategy, but in my view, this is a “pray and spray” approach. Yes, a few of your shots will hit, but many will miss.
I much prefer to be a sniper when it comes to picking my spots and initiating new positions.
I’ll wait patiently for months or years before initiating a position because I want to be as certain as I can that my purchase hit and that the purchase ends up being a great investment.
It is very hard to time the fundamentals of a business, usually, a company will perform well over 5-10 years, but the stock is all over the place affected by short-term news and narratives that drive the stock price and not the actual revenues and earnings.
This is why I like to zoom out and base my investment case on the long-term economics of the business, how it has performed, and how likely it is to continue to perform as well in the future.
Even if a great business is trading at a great price, it might not be a good time to buy it.
Yes, 5 years down the line it might end up being a good investment, but if there are tools we can use to get a better entry into a cheap quality stock, why should we not use it?
Tool #1: 200 Day moving average 📈
This is an indicator used by most industry professionals, and it is fascinating to see how often a stock will use the 200-day moving average as a support or resistance area. In my experience, the weekly 200-day moving average is the most accurate for long-term investors. I’m not interested in owning a business for 2 days, weeks, or months, I want to own it for the long term, but I want a good entry.
Example #1: Constellation Software
In late 2022, Constellation traded close to its 200-day moving average. This is rare for Constellation, and since there was no news related to the decline, this would’ve been a great place to enter the stock. It usually takes a lot of negative sentiment for strong trending stocks like Constellation to break its 200-day moving average.

On the flipside, the stock price can get too far away from the 200-day moving average as well - one can argue that Constellation is approaching that currently.
Example #2: Fortinet
Another example where timing your purchases close to the 200-day moving average would have turned out well.
Fortinet was trading sideways for ~3 years, but every time it broke below the 200-day moving average, the stock made strong recoveries.
Keep in mind: The business fundamentals were strong for Fortinet, but the narratives surrounding its earning reports were all over the place, leading to volatility.

Example #3: Apple
Another strong trending stock that rebounds off the 200-day moving average at multiple points in time.
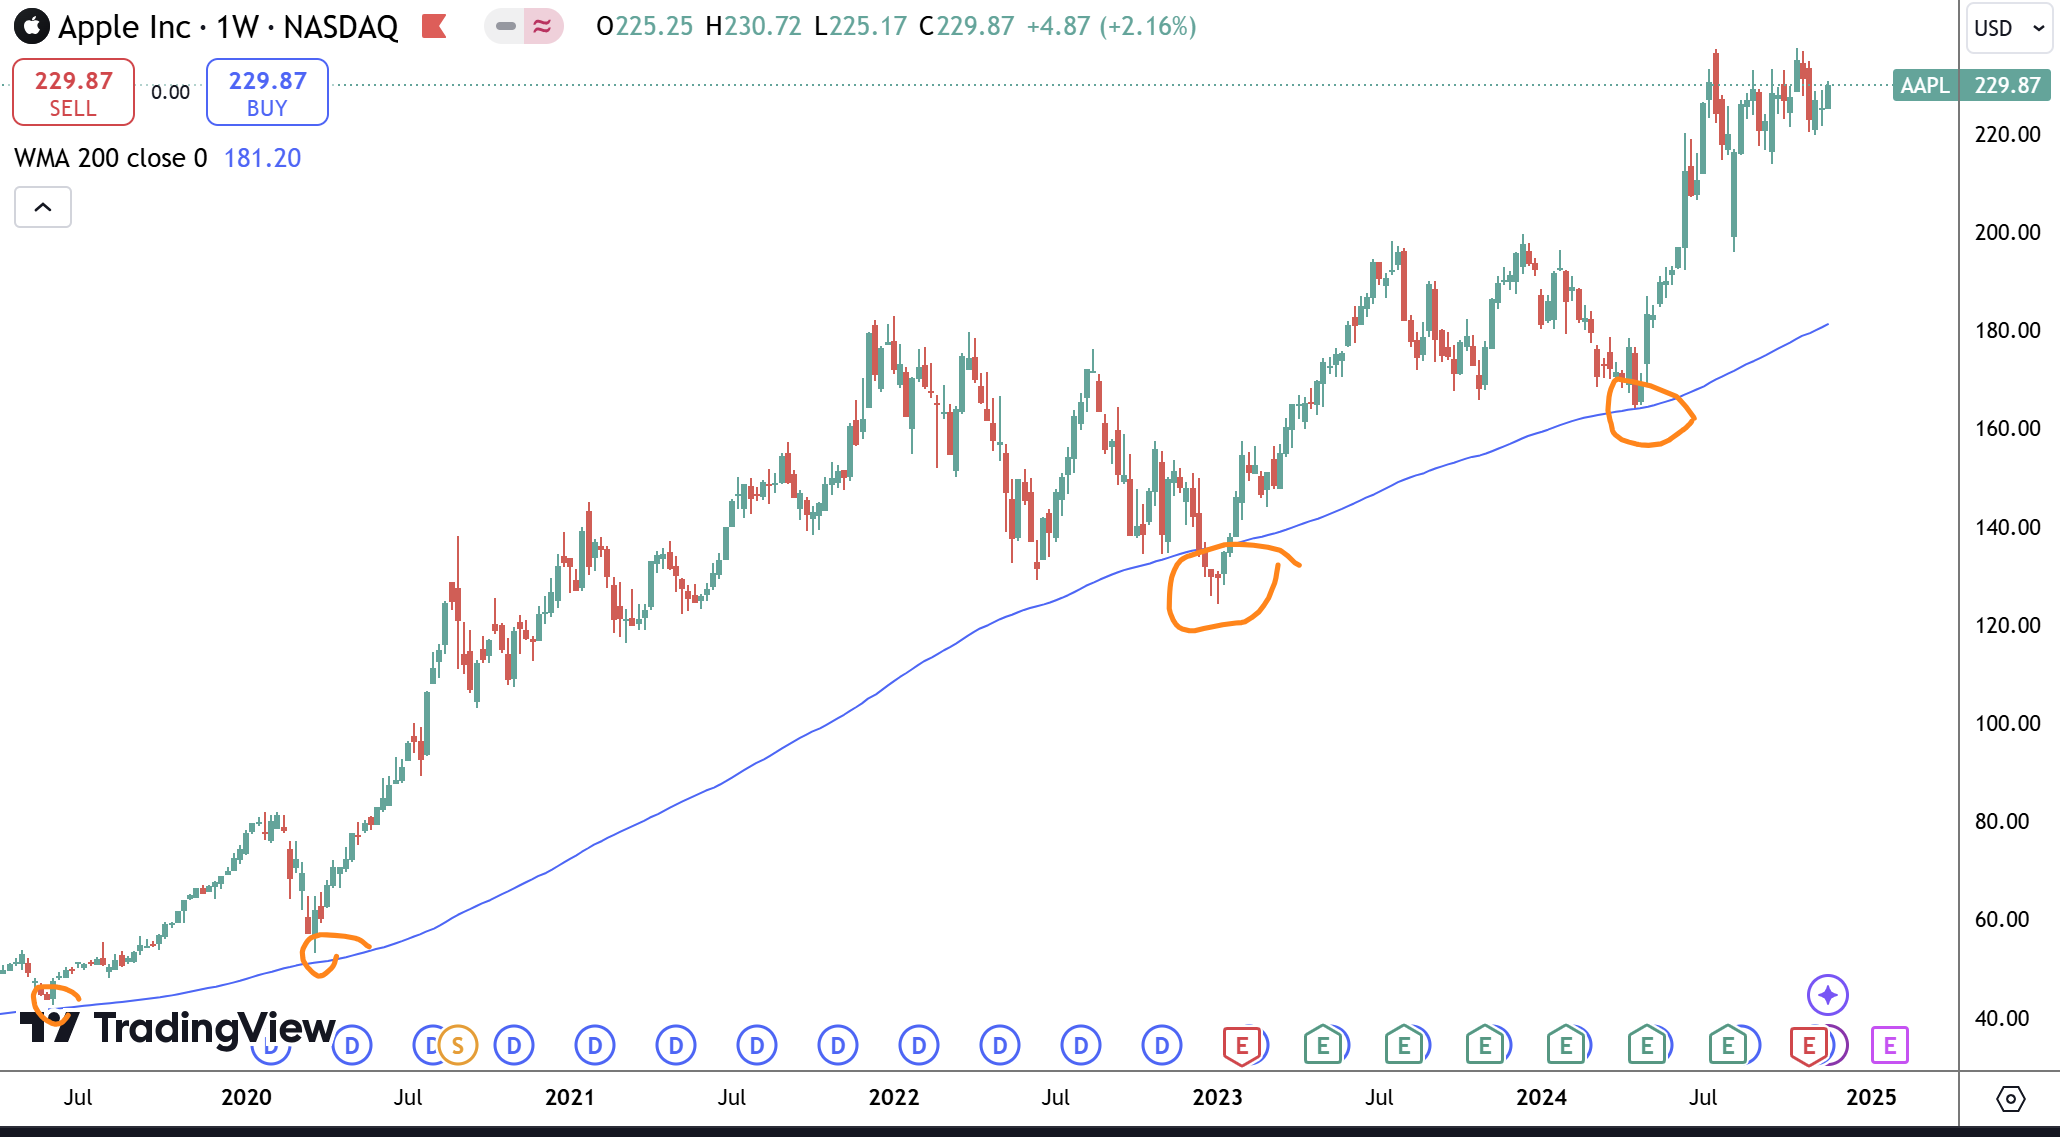
It should be made clear that the examples we are viewing here are all “dislocated quality companies”, meaning that the price is temporarily depressed and that the underlying business is of high quality and not going bankrupt.
This is why this type of analysis only should come after a thorough look at the business fundamentals and valuation.
Tool #2: Support lines or Resistance areas 📏
The 200-day moving average rule can be coupled with support lines. This is also called resistance and support lines used by traders to determine levels of demand.
The idea is that previous stock price highs and lows create areas where the price is less likely to penetrate. Let’s use an example to better explain.
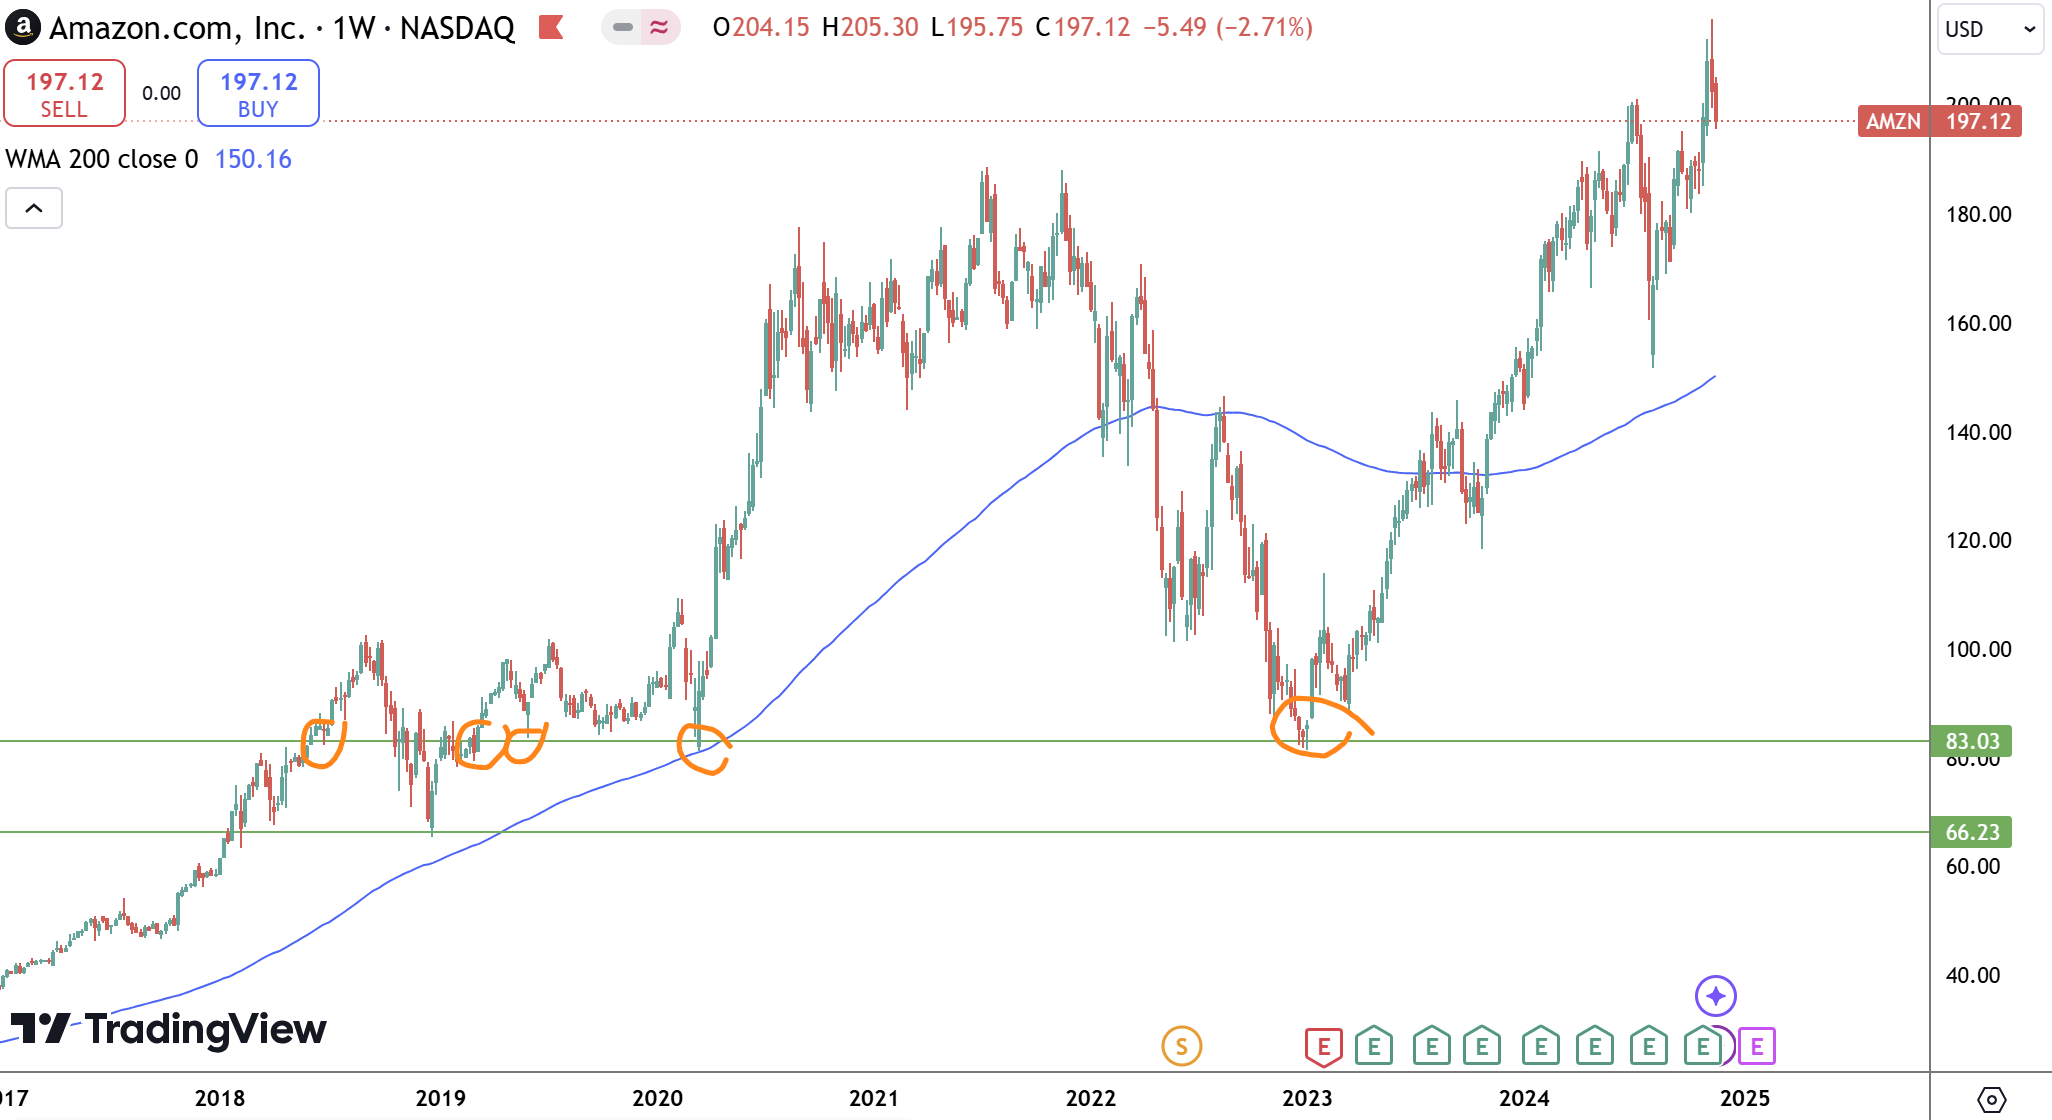
Example #1: Amazon
Amazon sold off aggressively in 2020 and did not turn around before early 2023. Notice that the exact bottom of the stock decline in 2022 was around the $83 mark. This was also the 2020 pandemic bottom level, and we can see that the stock used this price point as a resistance line multiple times from 2018 to 2020 and again in 2023.
Example #2: Evolution AB
Evolution AB is another example of support lines. The ~SEK940 area has been tested multiple times. It was first breached in 2021, where it consolidated, it was tested in late 2021 and hovered between this support area and the SEK810 resistance area. Then it again retested this support area in late 2023 / early 2024. And now we’re back at the same level.

Be mindful: This is not a guarantee that the stock will rebound, but if you like the quality of the business and its valuation, it can be a tool to get better entries into the stocks you want to purchase.
I first learned these methods from the famous value investor and former hedge fund manager Phil Town, I highly recommend his book for new investors:
Rule #1 Investing: The Simple Strategy for Successful Investing
That’s it for today — Merry Christmas!
Whenever you are ready, this is how I can help you:
Go Premium to access exclusive content & follow our market-beating Quality Growth portfolio. Read more here.
Essentials of Quality Growth — Join more than 250 investors who have bought the guide. Essentials of Quality Growth Investing is a multi-step guide for building a stock market portfolio of 10-20 high-performing quality compounders.
(Free) Valuation Cheat Sheet — Learn an easy and reliable method of valuing a business. Learn how to set a margin of safety for your investments.
(Free) How to identify a compounder — Learn how to effectively look for great companies that you can buy and hold for the long term.
(Free) How to analyze the financial statements — Learn how you read & analyze the balance sheet, income statement, and cash flow statement.
Promote yourself to +10.000 stock market investors (45% open rate) — Contact us via: investinassets20@gmail.com
Marius, thank you for this and all the wonderful articles you wrote and published during the past year! Keep up the awesome work!
Merry Christmas to you and your family, my friend! I hope to see you in Omaha next year in May!
Merry Christmas to you as well!