Hi partner 👋
In case you missed it:
In this article, we will discuss our top stock picks for May 2024.
Let’s get into it 👇
The Greed to Fear index is pointing towards Neutral
The market has been in Greed & Extreme Greed territory for a while.
When the market is fearful, it usually means that we get better entry points as long-term investors.
“Be greedy when others are fearful, and fearful when others are greedy”
— Warren Buffett
One month ago, the market was in “Fear”, it has since recovered and is now (again) approaching “Greed”.
The S&P 500
The S&P has recovered from the short-lived pullback in April/May. The index has made new all-time highs driven by Big Tech, Semiconductors, and AI-related businesses.
As an example, Nvidia keeps pushing higher, now valued at $2.618B with a compounded annual growth rate (CAGR) of +96.57% in the last 5 years (!).
Mr. Market
Mr. Market is a manic depressive who offers us deals every day.
It is our job to determine if the deals he offers, are on the depressive or manic side.
The month of May offers us a few interesting opportunities in quality businesses.
What is a good buy?
Our analysis process is outlined fully in our guide, read by more than 300 investors.
If you prefer video, we are currently creating a video course — sign up for a deal here.
We have also outlined a simple valuation method in our free valuation cheat sheet. One can use several methods, but we like to keep it simple.
First, we want to determine business quality by understanding the business, how it makes money, the different business segments, the growth potential for each segment or product/service, the margins, return on capital, and competitive advantage.
Second, we want to understand the historical valuation and price to earnings/cash flows the company has traded at. Then we use a simple discounted cash flow analysis to determine what direction the company is heading.
High-quality businesses, bought at fair prices, yield great long-term returns.
Disclaimer: This is not investment advice, always do your own due diligence and make your own investing decisions.
Top 5 Buys May 2024 🏰
Kinsale Capital KNSL 0.00%↑ 🤵🏻
Kinsale Capital is an insurance company specializing in excess and surplus lines.
The company has quickly expanded across the United States and is set to continue growing its network.
The founder & CEO still owns approximately 3.78% of the business.
Key Fundamentals:
Gross Margin: 26.15%
Interest Coverage: 43.5x
Operating Margin: 33.1%
ROCE 5-Year: 25.42%
EPS 5-Year CAGR: 48.57%
FCF per share 5-Year CAGR: 47.2%
CAGR Since Inception: 48.3%
Valuation and Buy Area
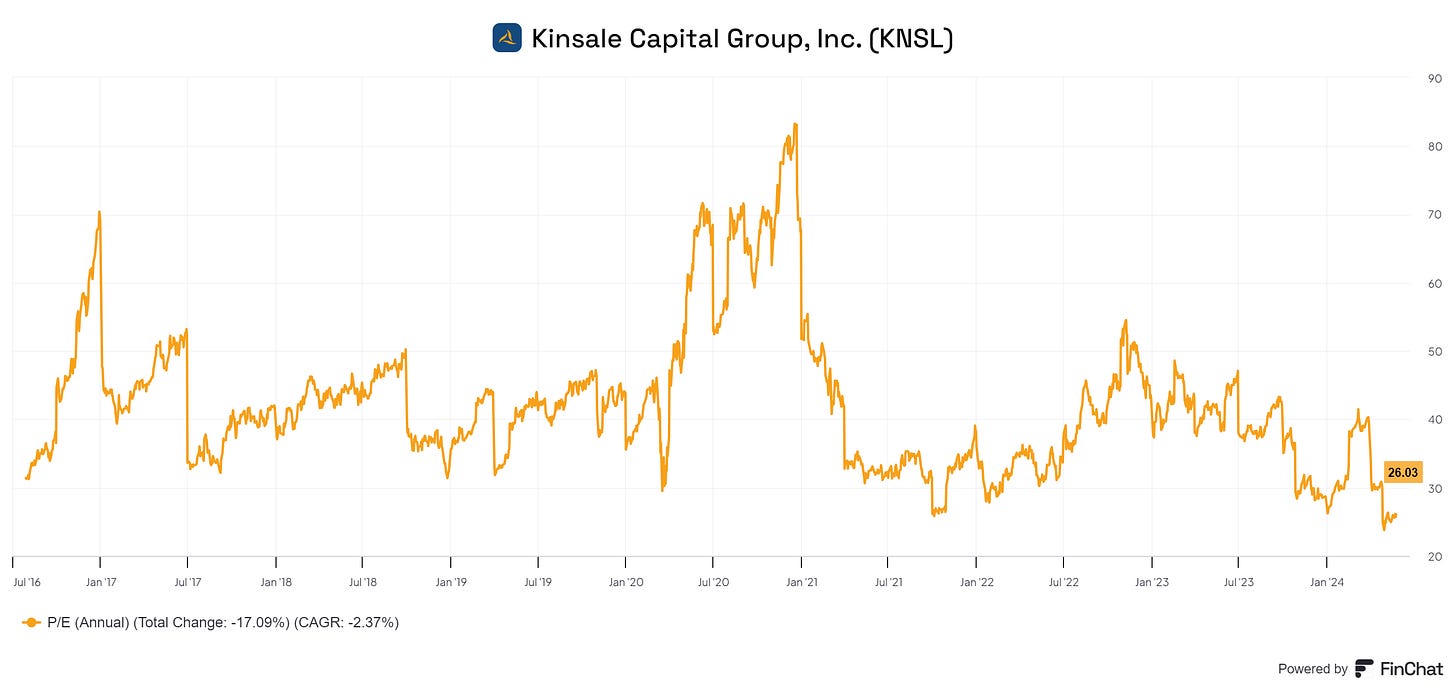
Kinsale Capital Group has seen its multiple contracts over the last 10-year period.
The contraction represents a negative -2.37% compounded annual growth rate (CAGR) for the business.
This makes their share price CAGR even more impressive.
The PE is currently at its lowest range in the last decade.
Simple discounted cash flow analysis
We want to be conservative in our estimates to create a margin of safety.
Using the EPS from the last twelve months (LTM) as a proxy for earnings.
With 3 different scenarios for growth between 10%-15% EPS growth in the next 5 years.
+15% long-term EPS growth is what analysts expect.
Fair value estimate for Kinsale Capital: $418.19
Current share price: $390
Upside: +7.2%
Note: If Kinsale can grow at 15% or above in the next 5-10 years, we assume that Kinsale will return +15% annually for its shareholders.
High Growth Expectations
Historical growth in EPS is 44.1% (3-Year CAGR), 48.57% (5-Year CAGR), and 31.96% (10-Year CAGR).
If we look at the analyst’s estimates:
EPS Fwd. 2 Years: +18.59%
EPS LT Growth Est: 15%
Medpace Holdings MEDP 0.00%↑ 🧬
Medpace Holdings is a contract research organization (CRO) that provides phase I-IV clinical development services to the biotechnology, pharmaceutical, and medical device industries.
The company has rapidly expanded its operations and is set to continue growing its global presence.
The founder & CEO still owns approximately 17.42% of the business.
Key Fundamentals:
Gross Margin: 66.44%
Interest Coverage: No interest expenses
Operating Margin: 18.07%
ROCE 5-Year: 29.83%
EPS 5-Year CAGR: 36.41%
FCF 5-Year CAGR: 29.89%
CAGR Since Inception: 40.3%
Valuation and Buy Area
Medpace Holdings currently trades in the high PE range from a historical perspective:
Simple discounted cash flow analysis
We want to be conservative in our estimates to create a margin of safety.
Using the FCFPS from the last twelve months (LTM) as a proxy for earnings.
With 3 different scenarios for growth between 10%-16% EPS growth in the next 5 years.
+17.91% long-term EPS growth is what analysts expect.
Fair value estimate for Medpace Holding: $462.50
Current share price: $390.55
Upside: +18.42%
Note: If Medpace can grow at 15% or above in the next 5-10 years, we assume that Medpace will return +15% annually for its shareholders. However, their source of revenue can be volatile, making them susceptible to performing poorly when the market is not investing in new trials.
High Growth Expectations
Historical growth in EPS is 32.47% (3-Year CAGR), 36.41% (5-Year CAGR), and 21.35% (10-Year CAGR).
If we look at the analyst’s estimates:
EPS Fwd. 2 Years: +21.41%
EPS LT Growth Est: 17.91%


