
My Investing Strategy🧠
<3m read

Investing Strategy
My investing strategy is a product of the greatest investors I am aware of.
I like to keep things simple, like Fundsmith:
Buy great businesses
Don’t overpay
Hold them for a long time
Buying companies of high quality
High-quality means:
Revenue, earnings, and cash flow growth
+10%
High returns on capital over time (ROCE)
+15%
Reinvestment rates
Ideally above 50%
High margins (Operating, free cash flow, and gross margins)
+50% GM
+10% Fcfm
High levels of cash conversion
+75%
Interest coverage above 10x
FCF yield above the risk-free rate preferably
2.5%-5% (High FCF growth can justify lower FCF yield)
Growth is one of the most important factors, because it drives the long-term performance of the biggest winners:
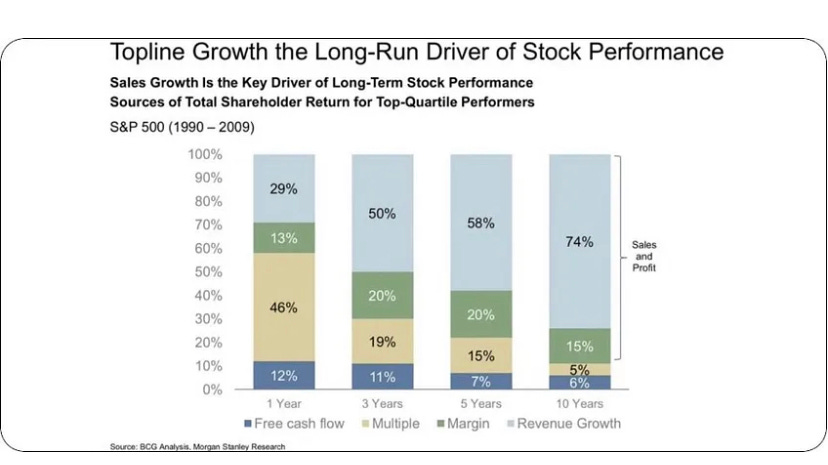
Note: Revenue growth alone is useless.
The less I have to pay for quality growth, the more interested I become, and the higher my bet out to be.
Why I focus on business quality:

Other traits I look for in companies for my portfolio:
Owner-operators (Founder led)
High insider ownership
Mission-driven (great mission statement)
Optionality - Companies that test new ideas out to fulfill its mission. Most may not work, but if only a few do, they will move the needle (Amazon is the prime example, Axon is another great example)
Non-toxic workplace (Glassdoor)
Low Cyclicality
Low Debt levels
Wide moats (Enduring competitive advantage): Growth means NOTHING w/o a wide moat
I want there to be a moat in place that protects the earnings of the business I invest in. There are several moats:
Network Effect: Each user makes the product better
Switching Costs: Hard to stop using
Low-Cost Production: Offer something for a cheaper
Intangibles: Patent, Brand, etc
Efficient scale: Uses scale to gain an advantage
Counter-Position: Competition harmed using your model
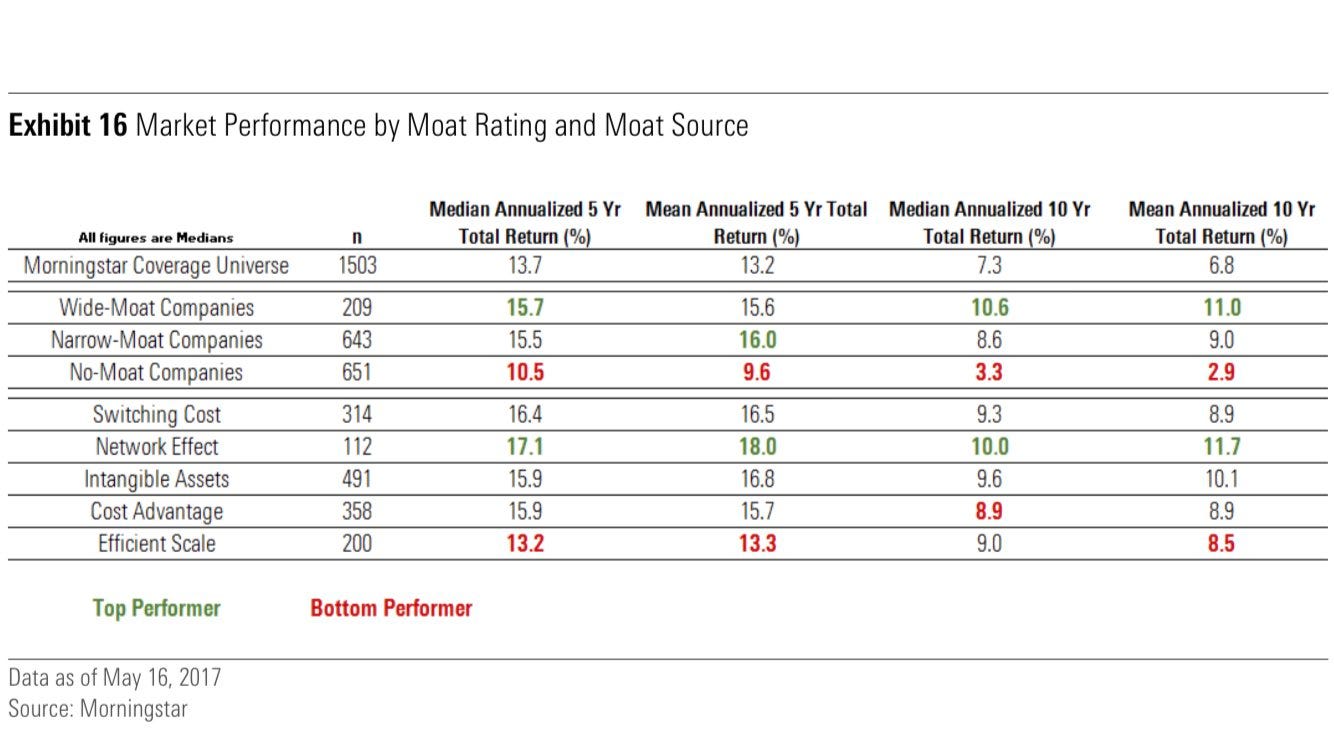
Companies with a moat outperform those without one:
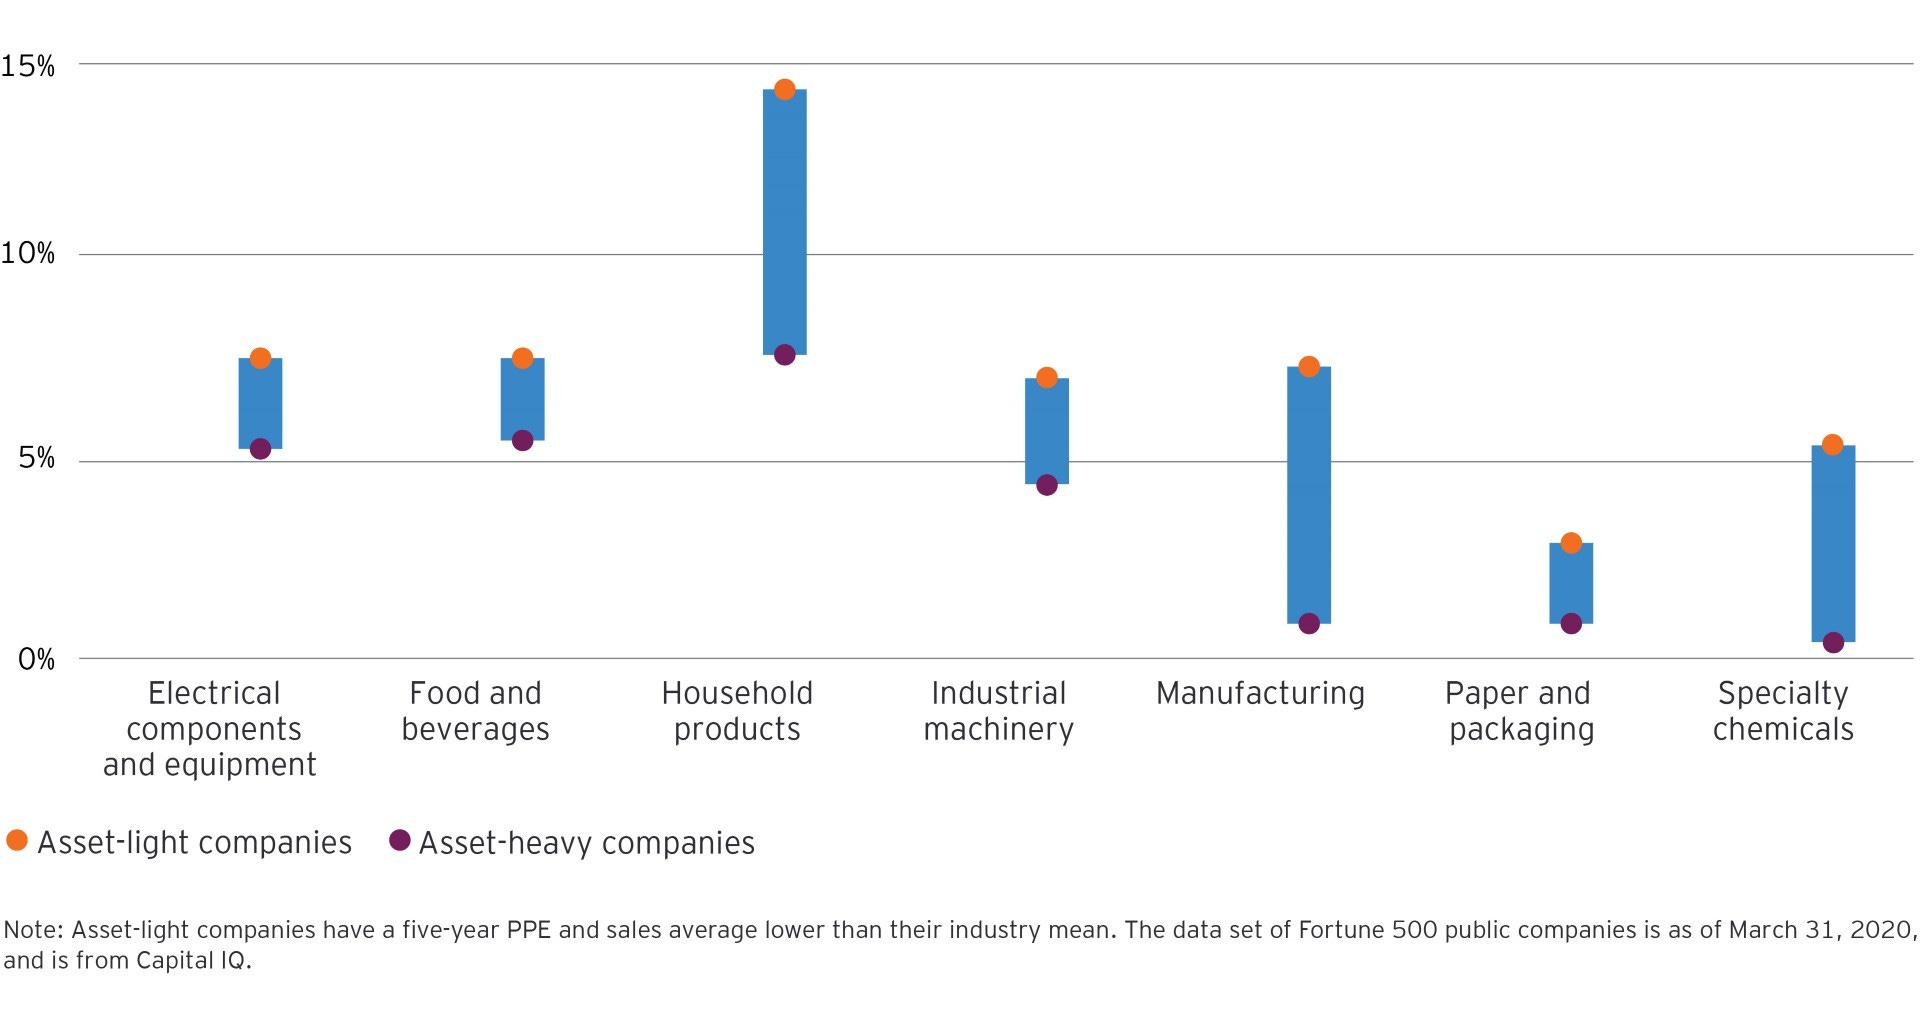
Capital light business models
Capital light companies tend to outperform their asset-heavy competitors:
My aim is to buy businesses with the following characteristics:
Capital expenditure / sales below 10%
Capital expenditure / Operating cash flow below 20%
Examples of capital light businesses: Admicom, Constellation, Adyen, Qualys.
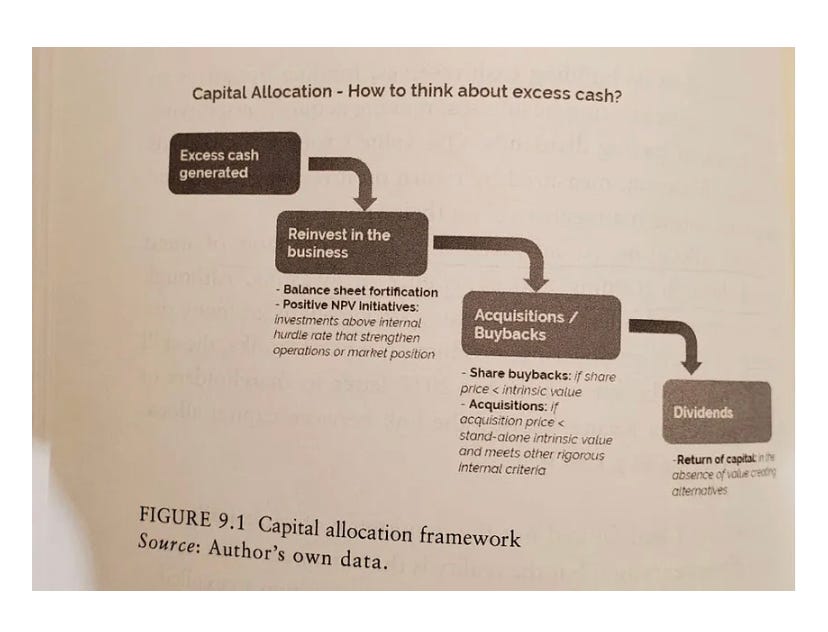
Capital allocation
The best CEOs are great capital allocators. Here is a list of what management can use excess cash on. Great capital allocators will know when to reinvest in the business when to buy back stock or do M&A. This metric can be viewed by calculating ROCE.
Examples: Jay Adair (Copart), Buffett (Berkshire), Mark Leonard (Constellation software), Jeff Bezos (Amazon)
The industry matters
Some industries have a higher ROIC than others. This is why Fundsmith has 1/3 in consumer products, 1/3 in healthcare, and 1/3 in software/technology.
I will primarily try to invest in these 3 sectors:
Consumer products (Household)
Healthcare
Software/Tech
These sectors tend to outperform because they offer more attractive ROIC and better long-term returns for LT shareholders:

I want to pick the best companies in the best, and most favorable industries.
Valuation
PE tells you nothing about the price you are getting
High PE can be cheap
Low PE can be expensive
It depends on the quality factors of the company
High FCF growth can offset a low FCF yield. FCF can grow at 20%+ per annum. 10-year treasury cannot.
I prefer companies with FCF yield above the 10-year treasury yield (3.65% as of 21.05.23).
I like to subtract stock-based compensation from FCF to get a more accurate picture of what the FCF for shareholders is.
Check out my “Valuation Cheat Sheet” (Its free): https://investinassets.gumroad.com/l/zxxpc
Linearity
I prefer companies with high linearity. I borrow this term from Long Equity (@long_equity on Twitter).
This means companies that have steadily increased in price for 5-10-20 years. No huge ups and downs like:

This is what I want:

Companies with a high linearity have consistently created value for its shareholders. It reflects stability in earnings and its business.
A few linear compounders:
Roper Technologies
Visa
Verisign
Factset
Tyler Technologies
Sherwin-Williams
That’s it. Let me know what you think in the comments below!
I pay particular attention to linearity as well. My method is to plot price on a log scale so that a straight line is a constant percent increase per unit of time. If a straight line (or channel) can be used to fairly represent the price movement over a long-ish period of time, then i simply measure the slope of the line in units of % increase per year. I look for the the high quality companies that have a minimum 15%/yr increase, and highlight those with >20%/yr. More or less it can be thought of as sort of a linear regression line, and the slope of that line is a better indicator than CAGR which depends of price start and end points.