Financial statement analysis is a must for any aspiring investor. In this article, we will discuss how you analyze a balance sheet. This is the first article in this series. The income statement and cash flow statement will be covered in later additions.
We often talk about the financial strength and a “healthy” balance sheet — but how do you actually analyze a balance sheet to determine if it is strong and healthy?
That question will be answered in this article:
How to analyze a balance sheet
A balance sheet consists of “Assets” and “Liabilities and shareholders’ equity”.
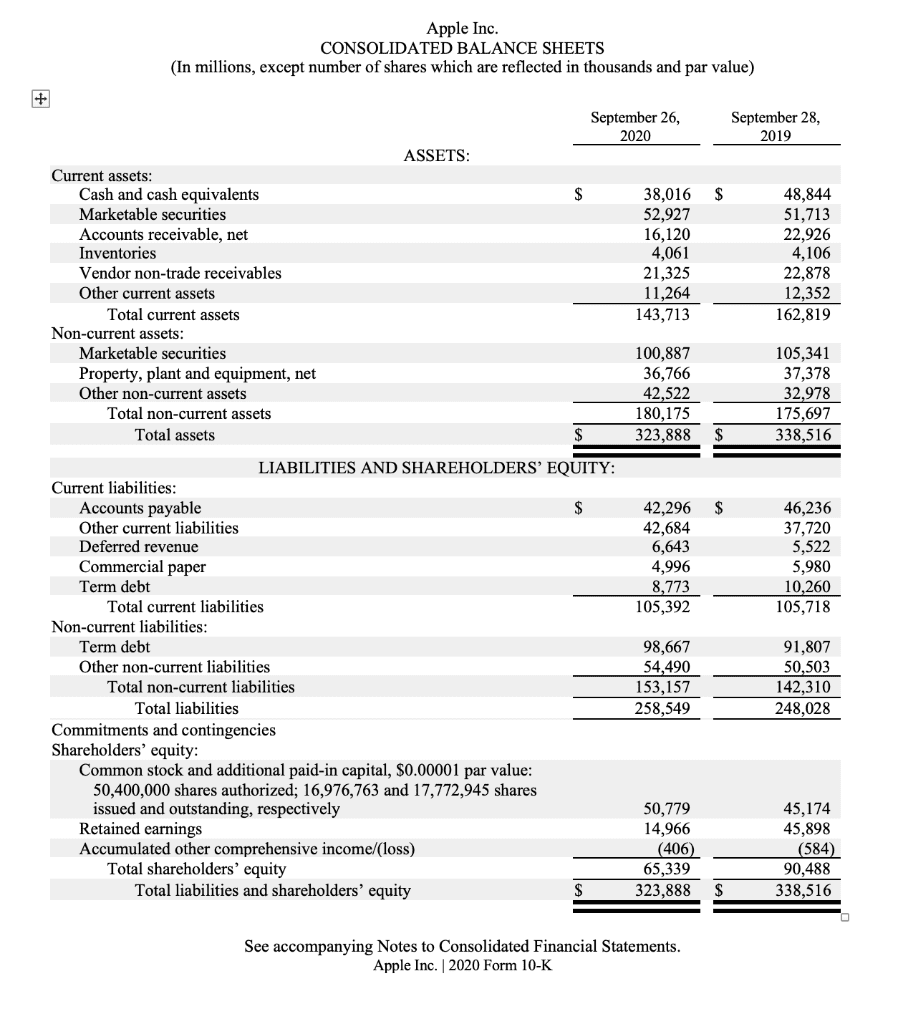
This is Apple’s balance sheet from 2019 to 2020:
Assets
Assets are everything a business owns. It is divided into two segments:
Current assets
Non-current assets.
Current assets typically include:
Cash & cash equivalents (Usually money market funds or short-term bonds to get some return on the cash)
Marketable securities (shares in other businesses)
Accounts receivables (Money coming in from customers in the short term - usually 90 days)
Inventories — Depending on the business, this is how much product is in their inventory that hasn’t yet been sold.
Current assets can be turned into cash in less than 12 months if needed. It is considered more liquid than the "non-current assets”. This is important because it tells us how likely a business is to handle turmoil.
A business with a lot of cash and liquid current assets, good control on accounts receivables (meaning payments are being collected on time), and stable and not growing inventories are all good signs and what we want to see.
Non-current assets include:
Marketable securities — Securities with maturity of more than 12 months (e.g. not as liquid as the securities in current assets).
Investment property - is property owned by the business that earns rentals capital appreciation or both.
Plant, property, and equipment - Buildings, factories, and production equipment used by the business.
Intangible assets - Patents, licenses, trademarks, brand.
Goodwill - The premium paid for an acquisition.
Non-current assets typically take longer to be turned into cash. It can take more than 1 year to sell a building for example. Additionally, intangible assets cannot be made liquid like a building can. Intangible assets can have immense value, and is indeed an asset, but not in the traditional sense.
As investors, we want to see a business that doesn’t need much to produce high profits. If the business is “asset heavy”, it will typically require a lot of PPE (Factories for example) to create profits and cash flows. Ideally, we want “asset-light” businesses that don’t need physical assets to achieve their returns. Instead, these businesses have valuable intangible assets that can be turned into profits and cash flows.
3 questions you should ask yourself for the assets:
How much cash does the business have compared to its short-term debt?
Are the accounts receivables growing faster than the sales? This could indicate that the business has a hard time collecting payments from their customers - we must find out why.
Is the inventory growing disproportionally to the business? If so, it might be a red flag, indicating that the business is unable to sell its products. This is something to watch out for with retail stores and clothing brands for example.
Liabilities
Liabilities are everything a business owes. It is divided into two segments:
Current liabilities
Non-current liabilities
Current liabilities include:
Accounts payable - Expenses incurred in the business operation that have to be paid in the short term, usually after 90 days.
Accrued expenses - An expense that is recognized on the balance sheet before it has been paid.
Other current liabilities - lumps together all current liabilities that are not significant enough to warrant their own line on the balance sheet.
Notes payable - written agreements (promissory notes) in which one party agrees to pay the other party a certain amount of cash.
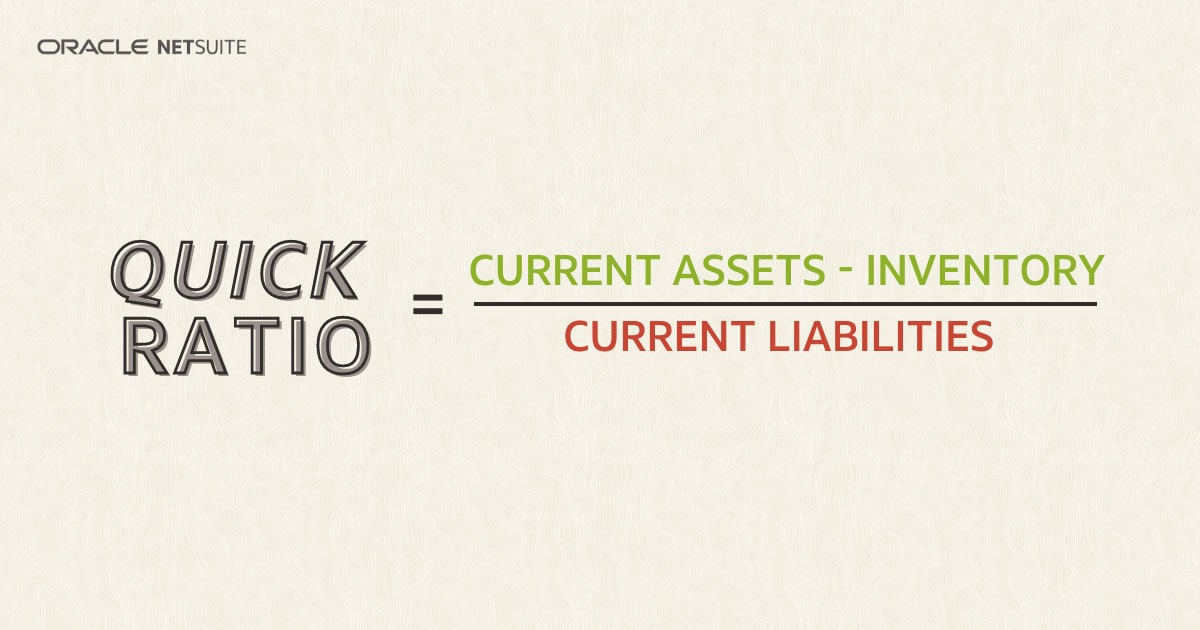
Current liabilities must be paid within the next 12 months and are considered the short-term debt and obligations a business has to its suppliers. From knowing the current assets, and the current liabilities, we can look at the “quick ratio” of the business, which tells us how healthy a balance sheet is in the short-term:
Non-current liabilities include:
Long-term debt — All debt that is not due within 12 months.
Other non-current liabilities — Examples: bonds payable, deferred tax liabilities, long-term lease obligations, and pension benefit obligations.
Non-current liabilities are not due for the next 12 months. A business with a lot of long-term debt can be a red flag if it doesn’t have the cash flows to support the payments in the future. When the interest rate goes from practically 0% to 5-8% in a very short amount of time, the interest expense on the long-term debt is greatly increased, which eats into cash flows.
Note: interest expenses will not show up on EBIT/EBITDA — hence the name, “earnings before interest & taxes”. But the cost is very real for companies with high debt levels. It will cut into the cash flows of the business.
Remember, cash pays the bills, not EBITDA.
3 questions you should ask yourself:
Are the current liabilities higher than the current assets? Not a good sign.
Is the cash position higher than the current liabilities? This is a good sign.
Are the short-term liabilities growing? If so, why?
Shareholders’ equity
Shareholders’ equity is a number of how much capital the investors have invested into the business. This number is often called the “book value” of the business because it is calculated as follows:
Formula: Total assets - Total liabilities
In other words, shareholders’ equity is what is left from the assets after we subtract all liabilities in a business.
The shareholders’ equity includes:
Invested capital - Investors stake in the business.
Retained earnings - What the company has earned minus what is paid out in dividends. This can be used for reinvestments, stock repurchases, special dividends, or acquisitions.
Treasury stock - Earnings set aside to purchase the company’s own stock
2 Questions to ask yourself for the shareholder’s equity:
Is the retained earnings growing every year?
What are the retained earnings used for? This will tell us if the management is a good capital allocator.
How to assess a company’s balance sheet in less than 5 minutes
It is a good thing to go into detail about the balance sheet of the business you are analyzing. Look at each line, and ask yourself—what does this mean? Why is accounts receivables going up? Why is the inventory increasing? Why has retained earnings stagnated? These questions will help you build your own narrative around a business that is not colored by financial media.
However, most of us are stripped of time, and we want an easy way to determine if a business will be able to pay its obligations, and ensure that it is not leveraged and relies on debt to deliver high returns.
Terry Smiths ratios:
Interest coverage
Net debt / Free cash flow
Check out the article on my strategy where I detail other financial metrics like this.
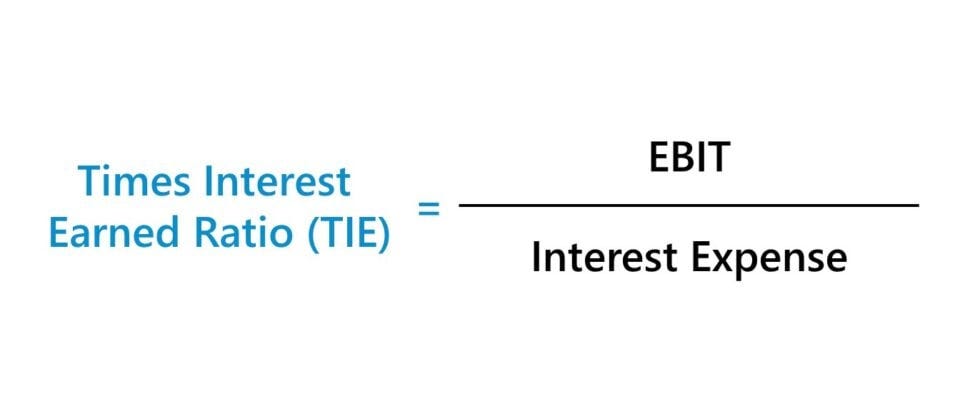
Interest coverage formula:
Net debt / free cash flow formula:
Net debt (Total debt - cash & equivalent) / free cash flow.
The index average for the two metrics are
Interest coverage ~10X
Net debt/FCF ~3.2X
Interest coverage tells us how many times the business can pay its interest expenses (found on the income statement) within 1 year of its earnings. The higher this number is, the better it is. It indicates that the business makes a lot of profits in relation to the debt they have. These businesses are unlikely to go bankrupt as long as the earnings are stable and they don’t pile on debt. If they do so, the interest coverage will let us know over time. If the interest coverage is getting smaller, we should ask ourselves why. It is either because EBIT is decreasing, why? Temporary or structural changes? Or it is because the interest expenses go up. Higher rates impact this but also increase debt levels.
Net debt to free cash flow tells us how levered the business is, and how likely the business is to be able to pay its debts on a long-term basis. A company with a net debt to FCF of 3, indicates that the business would be debt-free if it used its FCF for the next 3 years to pay down debt. This is a good indication of solvency. However, you have to look at the likelihood of the FCF continuing to be stable and ideally growing. More debt will affect this ratio, as well as lower FCF. My strategy is to look for businesses that don’t need leverage (debt) to deliver superior earnings over time. A business with low/manageable levels of debt is hard to bankrupt.
Warren Buffett’s ratio
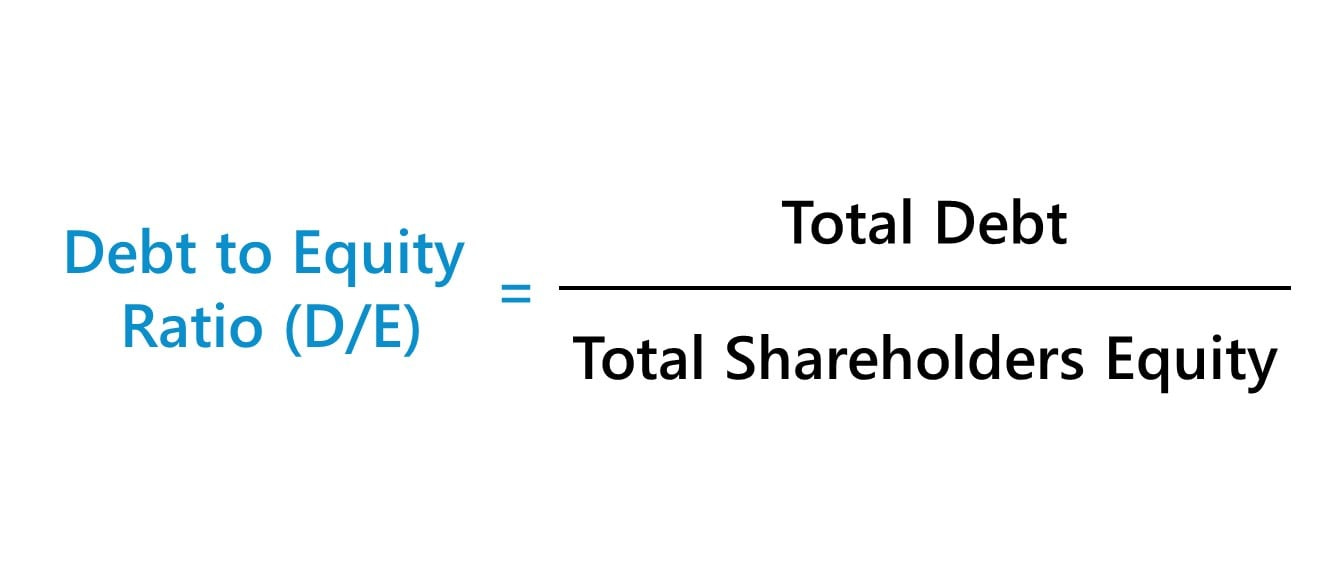
Buffett is known to use the debt-to-equity ratio to quickly determine how leveraged the business is.
The formula:
As a rule of thumb, the lower this ratio the better. Buffett prefers this to be below 1, and not higher than 1.5. A lower D/E ratio implies a less leveraged business.
That’s it!
Understanding the basics of a balance sheet is essential for a retail investor. The balance sheet can tell you how diligent management is at managing inventories, accounts payable/receivables, and hence working capital, and if the balance sheet will handle rainy days. Before making an investment in any company, you should determine that the business is healthy. As explained in this article, you can use a shortcut:
Interest coverage above 10x
Net debt to FCF below 3
This reduces the likelihood of investing disaster by a lot.
The only way to lose 100% of your money in the stock market, is to invest in a business that goes bankrupt. By understanding the basics of a balance sheet, you will not invest in these companies. And you will follow key indicators to make sure the balance sheet remains healthy.
Whenever you are ready, this is how I can help you:
Essentials of Quality Growth — Join more than 200 investors who have bought the guide. It is 8 years of experience condensed into 154 pages of how to successfully invest in the stock market.
(Free) Valuation Cheat Sheet — Learn an easy and reliable method of valuing a business. Learn how to set a margin of safety for your investments.
(Free) How to identify a compounder — Learn how to effectively look for great companies that you can buy and hold for the long term.
Promote yourself to +4.500 stock market investors (48% open rate) — Contact us via: investinassets20@gmail.com


I’m confused. You mentioned that the lower is debt-to-equity ratio the better. But at the same time you say that preferred values are “no lower than 0.5 - ideally 1+”. If the ratio is 1+ it would mean the company’s debt is greater or equal to its shareholder equity. Is that a typo?
Thank you for yet another great article!